How to Use the RCI Indicator: Reading Triple RCI on MT5, Choosing Between Signals, and Using RCI Triple Signal
Many traders find RCI "hard to use" or "full of false signals." But once you know how to read three RCI lines together and how to display them on MT5, you can judge the market's flow and your entry timing at the same time. Going step by step through the basics, how to read triple RCI, the MT5 display, and how to use alerts and divergence, even a beginner can get a working grasp of it. We also introduce "RCI Triple Signal for MT5," an indicator distributed by EdgeGraph FX that lets you put these methods to use as they are.
"RCI Triple Signal for MT5," with triple RCI signal display and alert functions, is available as a free download
Download RCI Triple Signal for free!Table of Contents
What Is RCI?
RCI (Rank Correlation Index) is an indicator that measures, as a number, how closely the order of time and the order of prices over a given period move in the same direction. Its value ranges from -100 to +100.
When price is rising steadily along the flow of the period, RCI approaches +100, and when it is falling steadily, it approaches -100. When there is no clear direction up or down, it hovers around 0. In short, RCI shows at a glance how cleanly the current price movement is rising or falling. You don't need to memorize the detailed formula; it is enough to understand that RCI looks at how well the rank of time matches the rank of price.
How to Read RCI: The Basics
There are three key points to learn first when using RCI.
The first is the ±80 lines. Above +80 is a guide for overbought, and below -80 is a guide for oversold. They give you a clue when looking for a reversal after an overextended move.
The second is the zero line. Whether RCI has crossed above or below 0 tells you which way the flow leans. Above 0, the upward side is dominant; below 0, the downward side is dominant.
The third is the direction of the line. Whether RCI is pointing up or down shows the direction of current momentum. The key is to watch the change in direction rather than the value itself.

How to Use Triple RCI
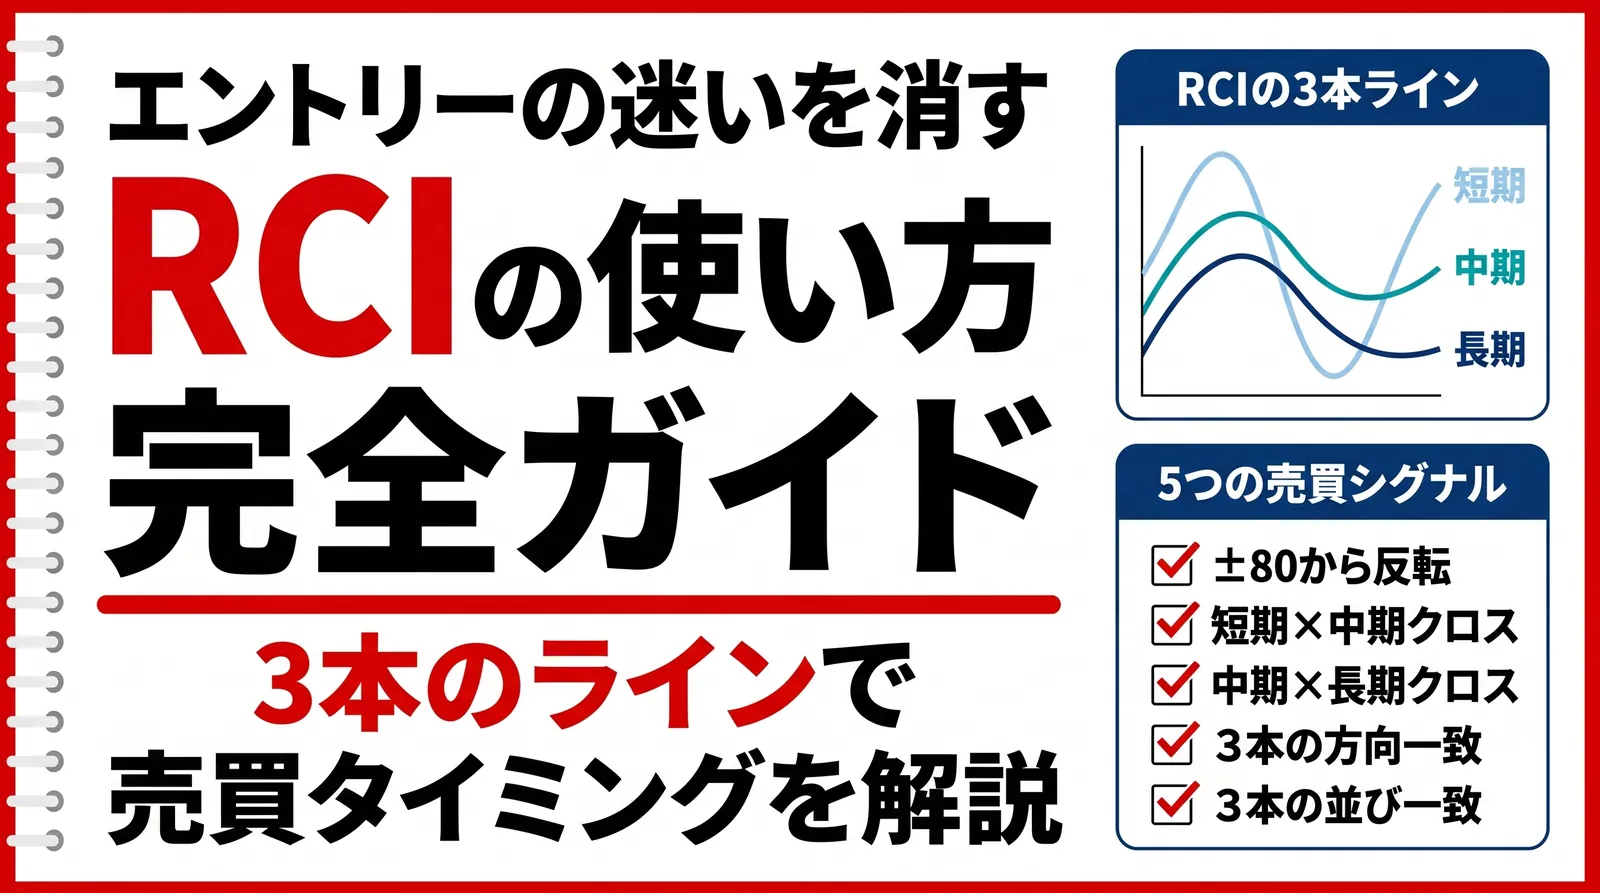
RCI works with just one line, but accuracy improves when you place three lines with different periods side by side. In general, you use a short-term, a medium-term, and a long-term line, and the standard periods are 9, 26, and 52. The short-term line shows immediate momentum, the medium-term line shows the flow over several days, and the long-term line shows the larger trend.
With triple RCI, you mainly watch two things: aligned direction and crosses. Aligned direction is when the short-, medium-, and long-term lines all point the same way, which confirms that a trend is present. A cross is when a shorter-period line moves above or below a longer-period line, and it is a clue for finding turning points in the flow.
The quick-reference table of five signals introduced in the second half organizes this aligned direction and these crosses so you can use them according to the market situation. If you often wonder whether to trust the cross or the aligned direction, lining them up by situation makes the decision easier.

RCI Weaknesses, Cautions, and a Two-Stage Way of Reading to Reduce Hesitation
RCI has weaknesses too. When a strong trend continues, RCI can stay stuck near +100 or -100 without moving. If you trade against the trend by looking only at ±80 at that point, you tend to end up selling into a market that keeps rising. Also, in a low-volatility range market, crosses appear repeatedly and are likely to turn out to be false signals.
To reduce these mistakes, we recommend checking things in a fixed order. Check in the following sequence.
First, decide the direction of the larger flow using the direction of the long-term RCI and the alignment of the three lines. Next, narrow down entry candidates using a short-term RCI reversal or a short-medium cross that follows that direction. Then confirm that the RCI on a higher timeframe points the same way, to back up the direction. Finally, check whether a divergence has appeared, where price makes a new high or low but RCI fails to follow, and watch out for fading momentum.
Simply using this two-stage approach of deciding the direction first and then picking the timing can reduce the mistake many beginners make: being fooled even though a cross appeared.
Displaying RCI on EdgeGraph FX's MT5
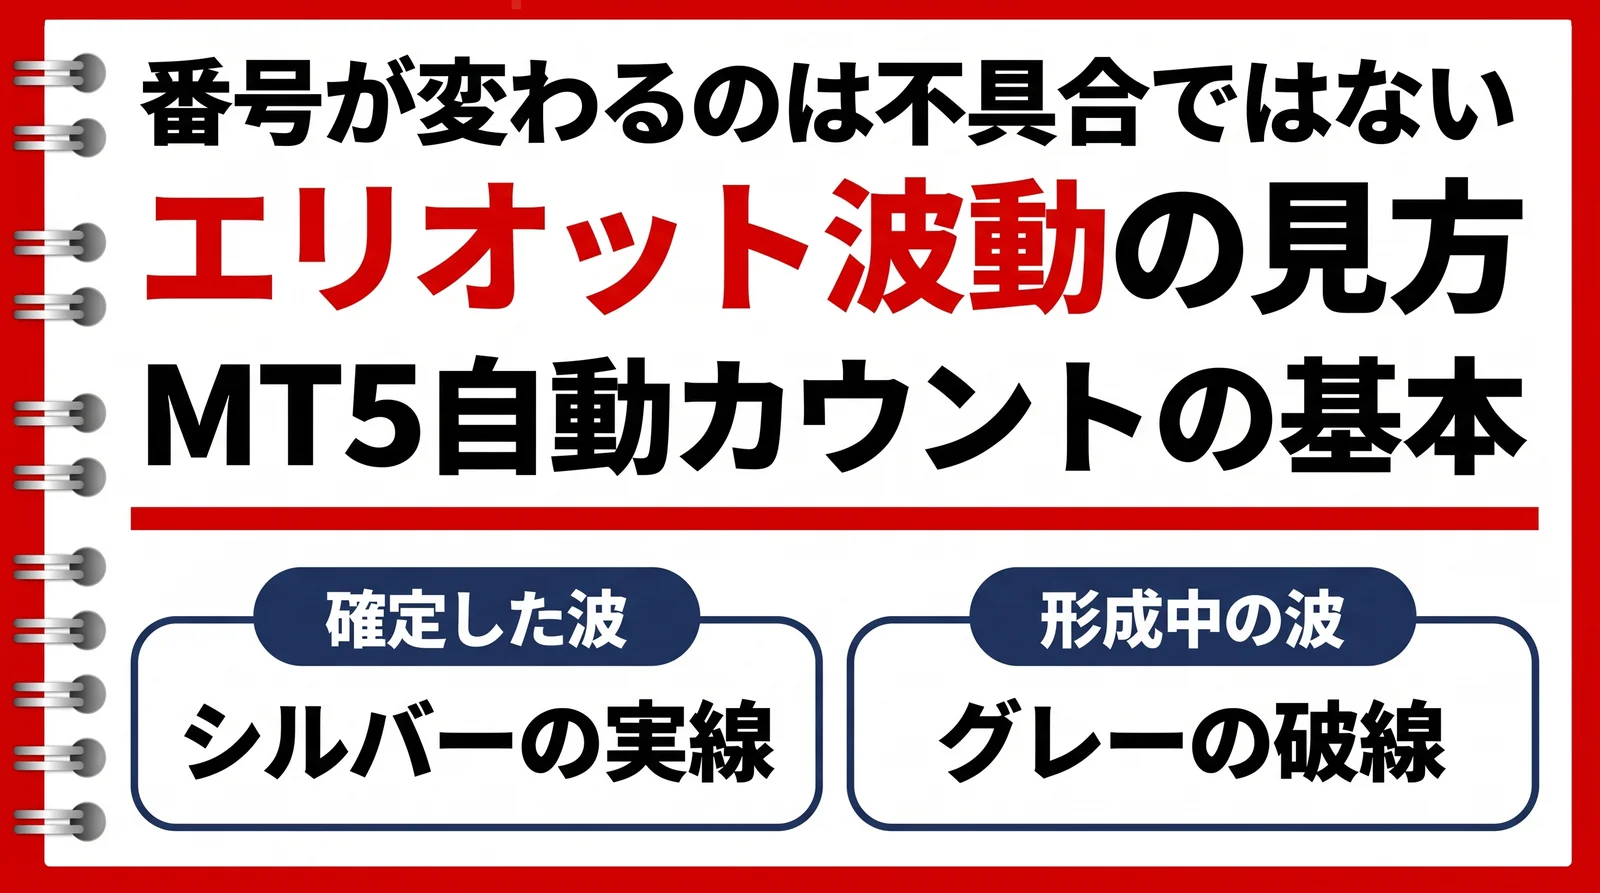
RCI is not an indicator that comes built into MT5. To use it, you need to obtain an RCI indicator file separately, add it to MT5's data folder, and call it up from the indicator list in the Navigator. On top of that, to line up three RCI lines, you have to repeat this work three times while changing the period.
EdgeGraph FX distributes "RCI Triple Signal for MT5." With this tool, you can eliminate both the trouble of adding RCI to MT5 and the burden of comparing three lines to judge crosses and aligned direction.
If you haven't installed MT5 yet, check this article!
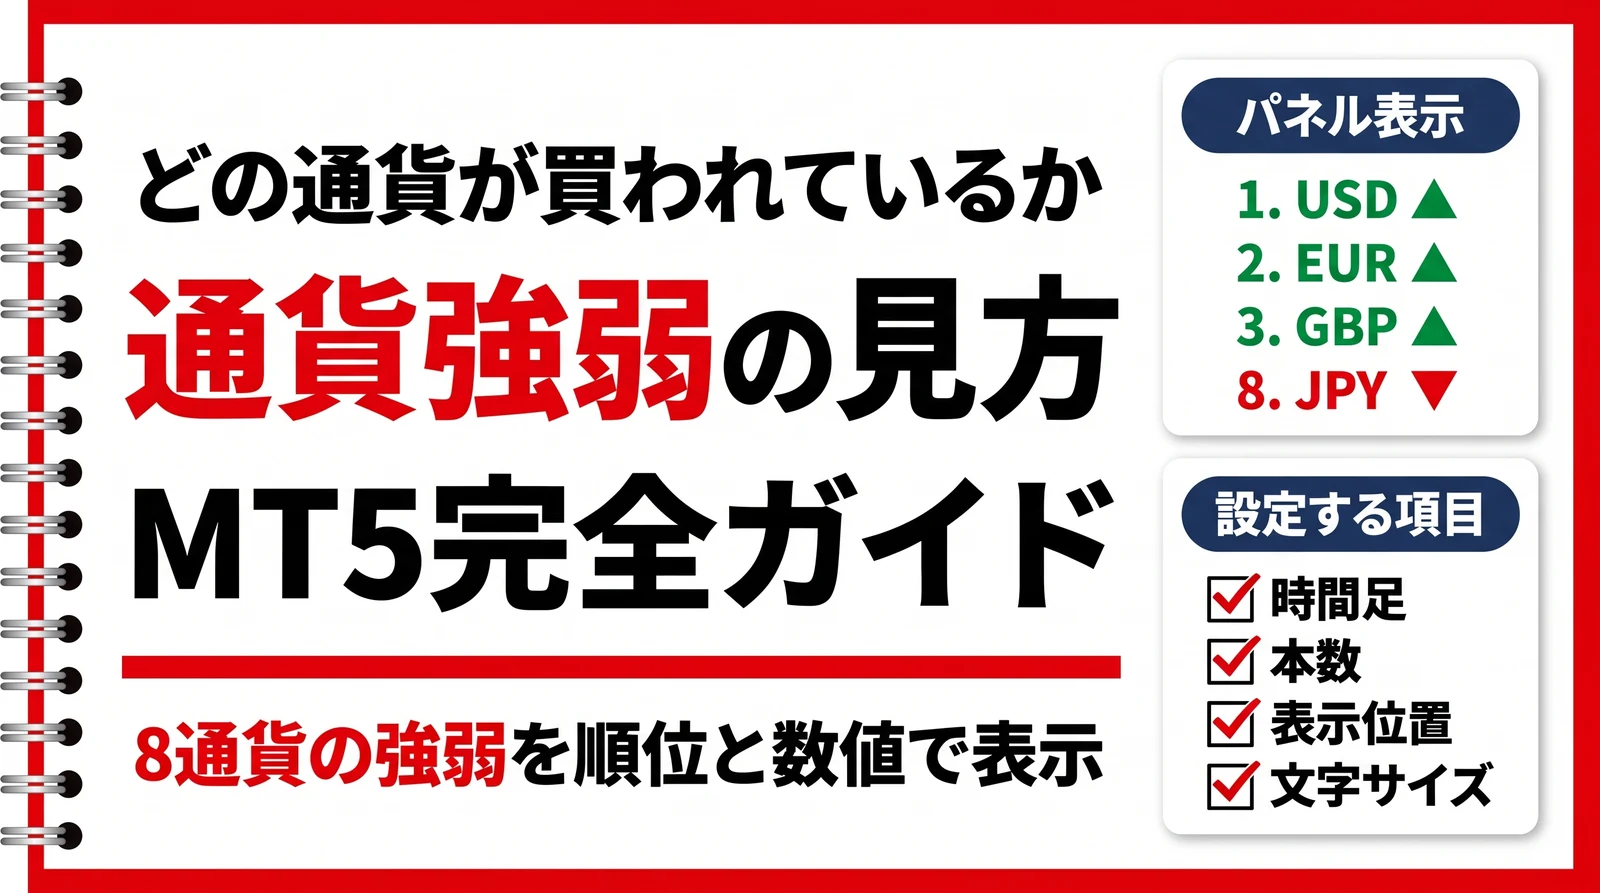
If you want to see numerically which currencies are being bought, check this article!
What You Can Do with RCI Triple Signal for MT5
RCI Triple Signal for MT5 is an indicator for EdgeGraph FX that uses three RCI lines to make it easier to judge the trend and entry timing. You can download it for free and start using it right away. In addition to the basic RCI display, it offers the following features.
- Displays the short-, medium-, and long-term RCI lines in a separate window
- Five types of buy and sell signals
- Divergence detection that finds when price and RCI move against each other
- Multi-timeframe display so you can see RCI from another timeframe at the same time
- Various alerts when a signal occurs
- Signal arrows shown above the candlesticks on the main chart
The ±80 lines and the zero line can each be turned on or off, and each of the five signals can have its display and alerts switched individually. Its feature is that the approach explained in the first half, deciding the direction first and then picking the timing, can be carried out as functions as they are.
Using the Five Signals
This indicator organizes aligned direction and crosses into five types of signals. The quick-reference table below summarizes which signal indicates which kind of market situation.

Quick Reference for Using the Five Signals
| Signal | What it captures | Situations where it works best |
|---|---|---|
| Short-term RCI crosses the ±80 line | A reversal from an overextended move | Ranges, and the start of a pullback or retracement |
| Short-term RCI crosses medium-term RCI | A turn in the short-term flow | Early entry decisions |
| Medium-term RCI crosses long-term RCI | A turn in the larger flow | A change of trend |
| Direction match of the three RCI lines | Short, medium, and long all point the same way | Confirming that a trend has started or continues |
| Order match of the three RCI lines | The positions of short, medium, and long line up | Supporting a strong trend |
Short-term reversals and short-medium crosses suit catching an early timing, while direction matches and order matches suit riding a trend. If you can choose which signal to use according to the situation, your judgment will waver less.
Note that you do not have to enter every time a signal appears. Use signals as material for your judgment, combined with the trend direction and support and resistance.
Raise Accuracy with Divergence and MTF
Divergence is a movement where price makes a new high or low but RCI fails to follow, and it is a sign of fading momentum. RCI Triple Signal can detect both Bullish (rising) and Bearish (falling) divergence. Detection is off by default, so turn it on in the settings screen when you want to use it. It gives you a clue for judging whether the end of a trend is near.
MTF (multi-timeframe) is a function that lets you check the RCI of a timeframe other than the one you are viewing on the same screen. For example, if you display the 15-minute RCI while watching the 5-minute chart, you can check whether your entry follows the higher timeframe's flow without switching screens. You can carry out the step of backing up the direction on a higher timeframe, mentioned in the first half, as it is.
Don't Stay Glued to the Chart: Alerts and Main-Chart Arrows
Waiting for RCI to stick or cross is exhausting. RCI Triple Signal lets you set alerts for each signal. It supports four types: pop-up display, alert sound, push notification to your smartphone, and email. So even without staying glued to the chart, you can notice and check only when a signal occurs.
In addition, when a signal occurs, a blue BUY arrow for a buy candidate and a red SELL arrow for a sell candidate appear above the candlesticks on the main chart. You can judge just by looking at the candlesticks, without going back and forth between the RCI window and the price chart. When multiple signals overlap on the same candlestick, the arrows are automatically stacked vertically.
These signals are judged on closed candles and never repaint. This means the position of an arrow will not shift afterward. It directly answers a point traders often worry about when choosing a signal tool.
If you want to know the settings screen items and default values of RCI Triple Signal, check this article!
Setting Guidelines by Trading Style
Keep the periods at 9, 26, and 52 as the basis, and change the timeframe you watch to suit your trading style to make it easier to use. Use the table below as a guide.
Setting Guidelines by Trading Style
| Style | Short / Medium / Long | Suggested timeframes | How to read signals that work well |
|---|---|---|---|
| Scalping | 9 / 26 / 52 | 1-minute, 5-minute | Act quickly on short-term reversals and short-medium crosses |
| Day trading | 9 / 26 / 52 | 15-minute, 30-minute, 1-hour | Ride the trend with direction match of the three lines |
| Swing trading | 9 / 26 / 52 | 4-hour, daily | See the big picture with medium-long crosses and order match |
The periods stay at 9, 26, and 52 for every style; what you change is the timeframe you watch. If you decide the settings, the timeframe, and which signals to weight most as a set, you can start using it without hesitation.
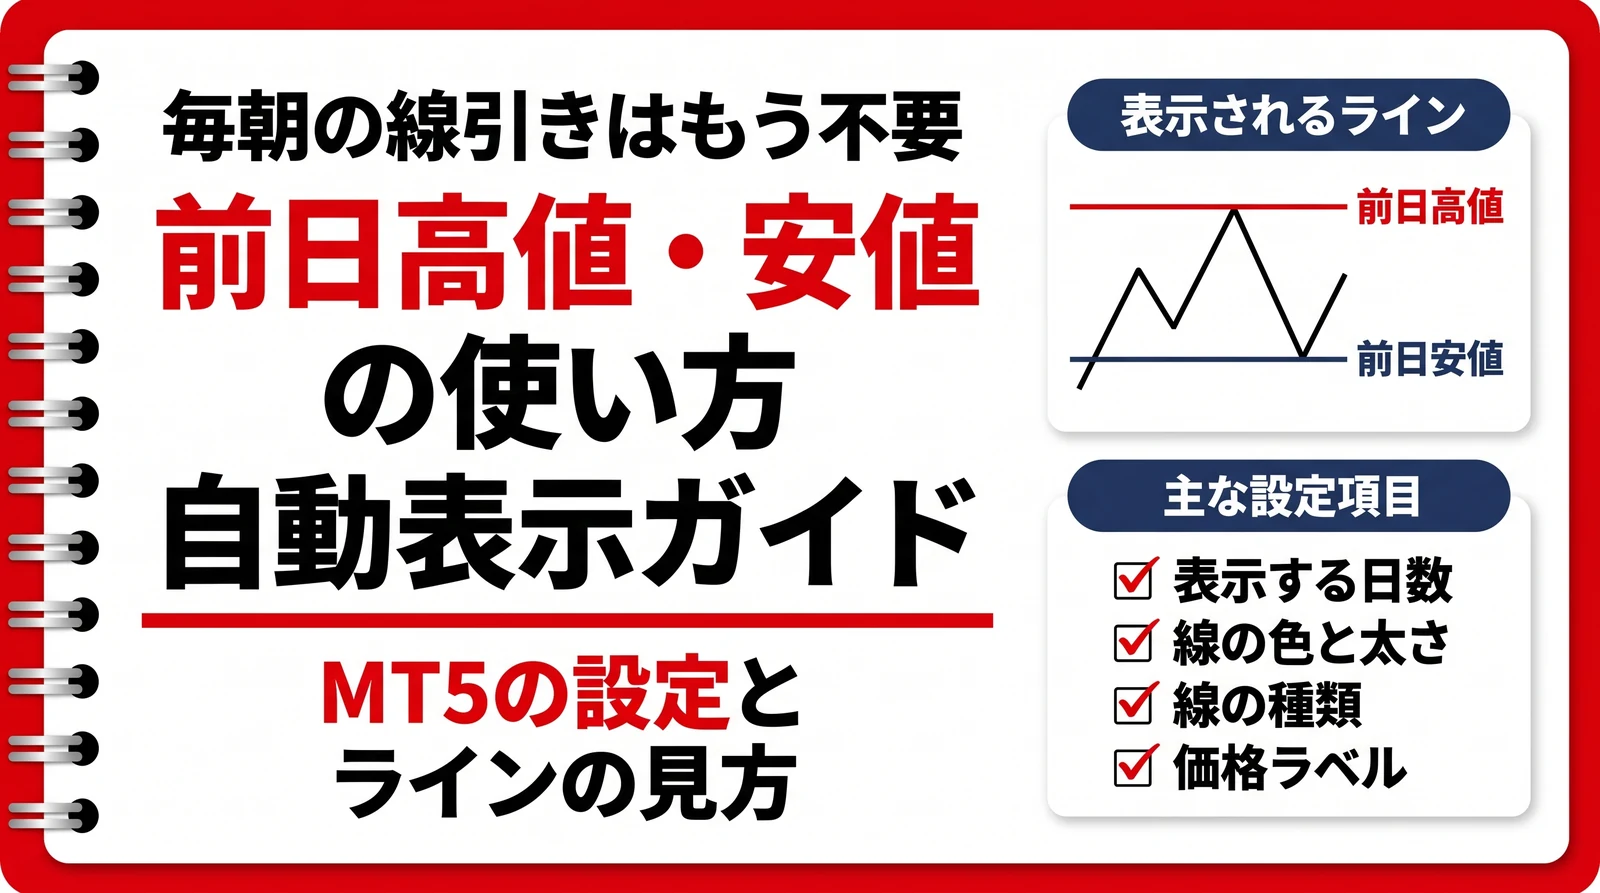
If you want previous-day highs and lows drawn automatically, check this article!
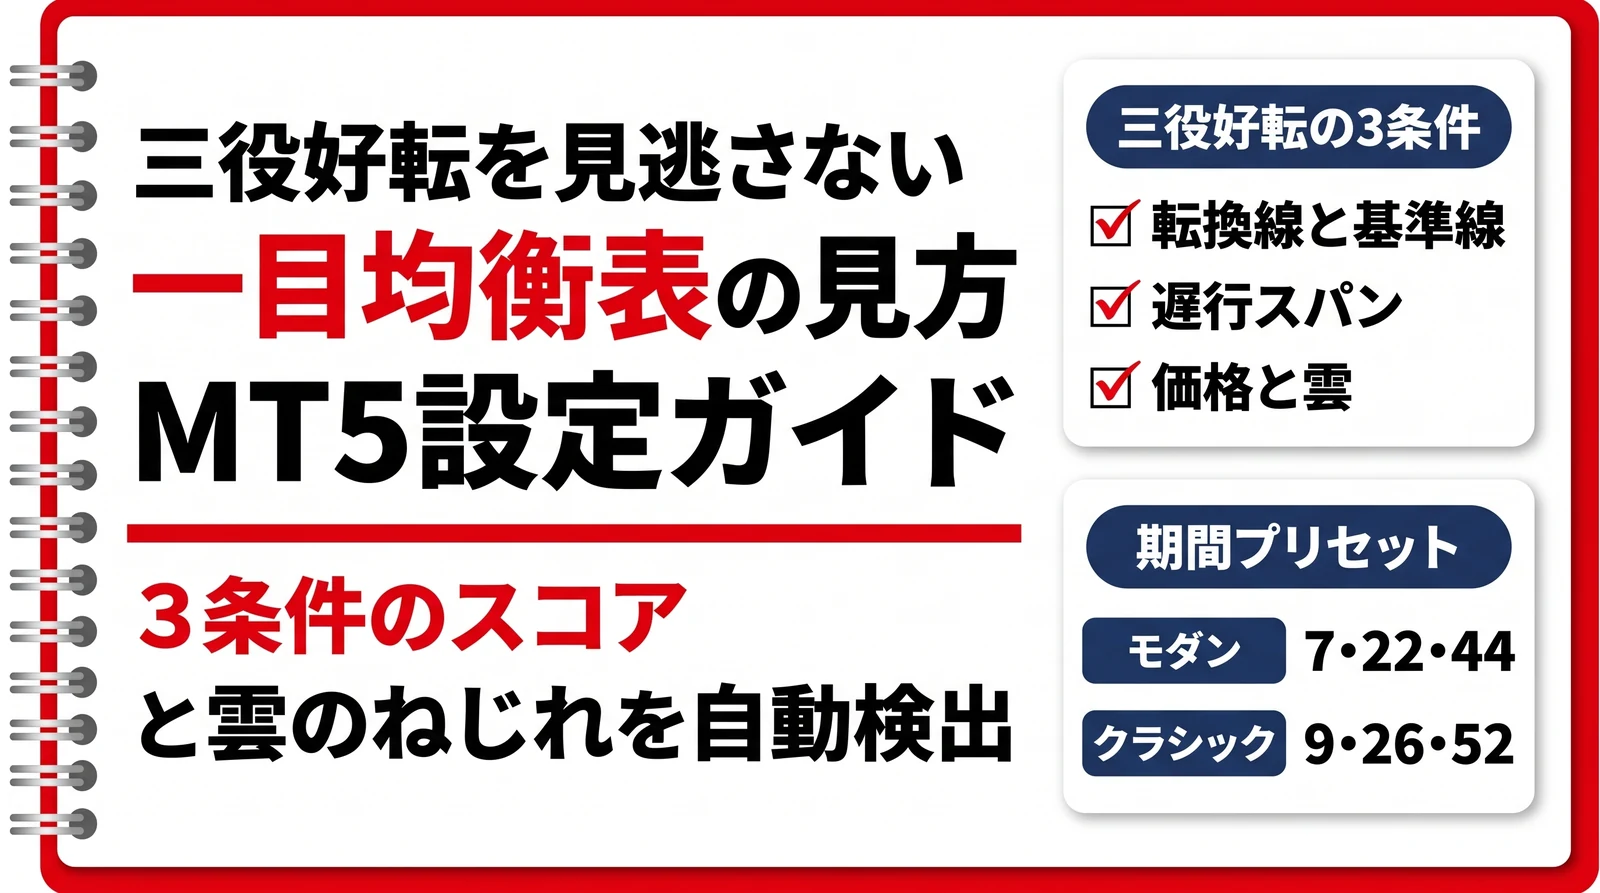
If you want to see trend turning points with the cloud and five lines, check this article!
FAQ
Summary
RCI is an indicator that reads the flow of the market from the correlation between the ranks of time and price. If you grasp the ±80 lines, the zero line, and the direction of the line, and use the aligned direction and crosses of triple RCI according to the situation, your judgment becomes easier. With the two-stage approach of deciding the direction first and then picking the timing, you can also reduce failures caused by sticking and false signals.
RCI Triple Signal for MT5 is an indicator that carries out this way of reading as it is, through five signals, divergence, MTF, alerts, and main-chart arrows. It is exclusively for EdgeGraph FX's MT5 and can be downloaded and used for free. Start by adding it to your chart and see how the three RCI lines actually move!
"RCI Triple Signal for MT5," with triple RCI signal display and alert functions, is available as a free download
Download RCI Triple Signal for free!