How to Draw Fibonacci Retracement: Color-Coding Levels in MT5 and Placing Your Stop Loss
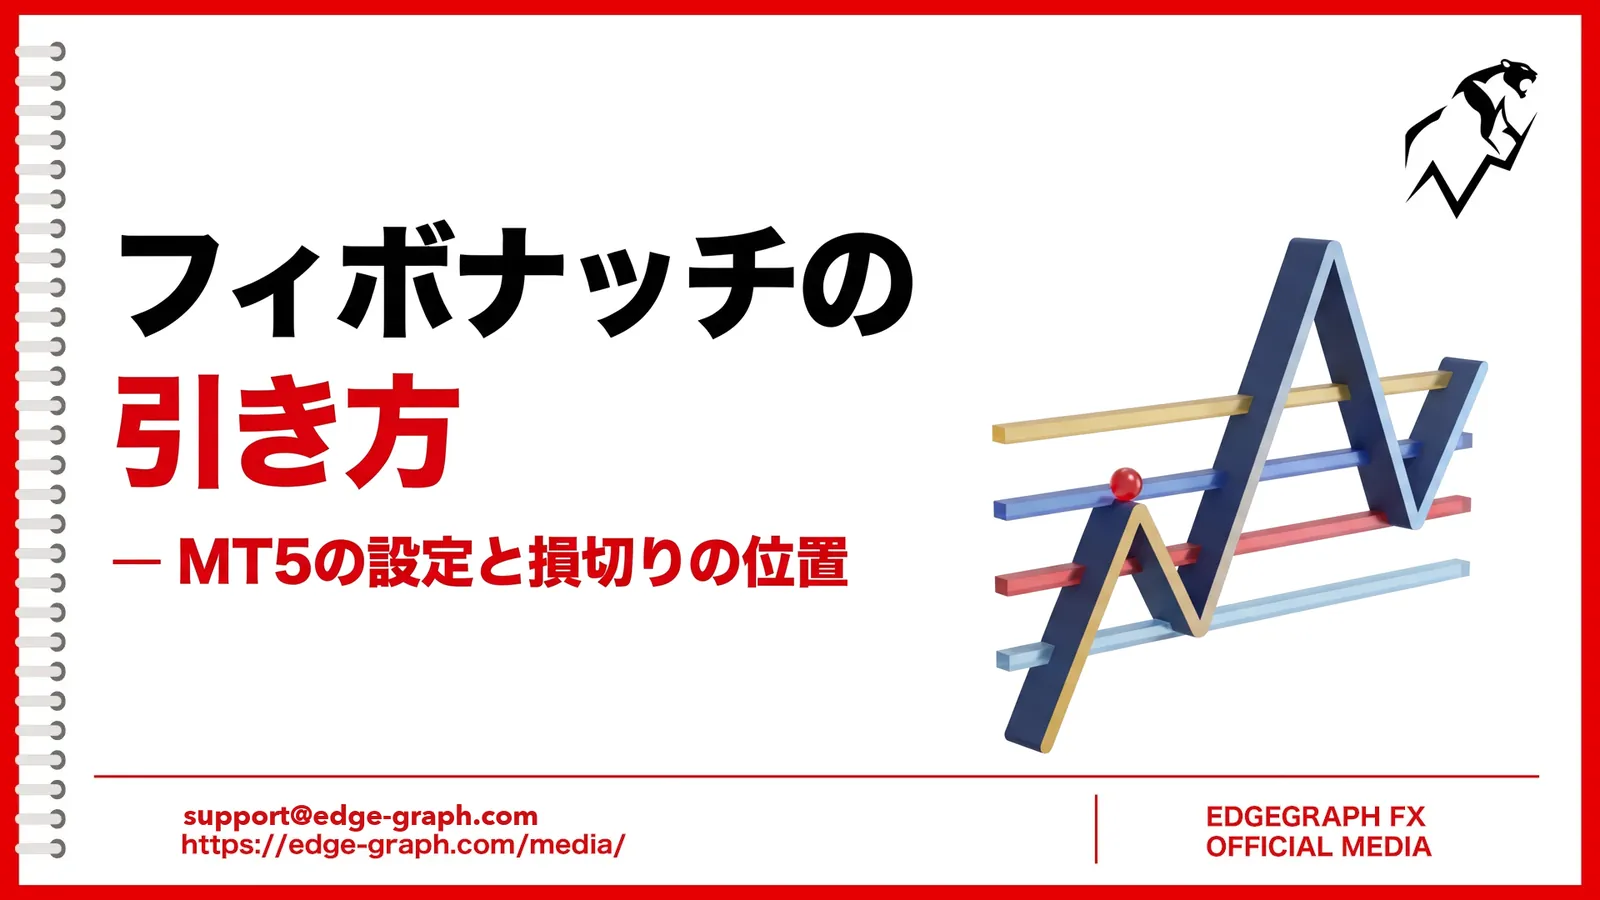
When you look at an uptrend chart, it can be hard to decide how far price has to fall before you buy. One way to find a price-based guide for a pullback is Fibonacci retracement.
When you pick two points, a high and a low, and draw Fibonacci, horizontal lines appear that serve as guides for a retracement. However, the position of the lines changes depending on which high and low you choose and which direction you draw.
This article explains how to draw Fibonacci, how to set it up in MT5, and how to decide your stop loss from the levels you drew.
Table of Contents
How to Read Fibonacci Retracement
Fibonacci retracement is a tool that shows, as percentages, how far price may retrace relative to the preceding price move.
For example, if USD/JPY rises from ¥150.00 to ¥152.00 and then starts to fall, horizontal lines at 23.6%, 38.2%, 50%, 61.8% and so on show what percentage of the ¥2 rise has been retraced.
Commonly Used Ratios
Start by checking the three lines at 38.2%, 50% and 61.8%. Watch whether price stops near 38.2% for a shallow pullback, or near 61.8% for a deep one.
23.6% is used as a guide for a shallow pullback in a strong trend, and 78.6% as a guide after price breaks below 61.8%.
23.6%, 38.2% and 61.8% come from the ratios between numbers in the Fibonacci sequence, in which each number is the sum of the previous two. 50% is not a ratio derived from the sequence, but it is a level watched as a half retracement, so it is displayed together with the others.
Price Does Not Always Bounce
Price does not necessarily stop at a Fibonacci level. Because some traders place orders at the same level, trading simply tends to increase around it.
Not just Fibonacci, but indicators and drawing tools in general show guides based on past price movement. They do not predict future price movement, so use them as one input for your decisions.
A level that overlaps with a horizontal line, a round-number price, or the previous day's high or low is more worth watching to see whether price stops there.
Also, in a ranging market that moves back and forth, you cannot settle on a single swing to draw, so Fibonacci becomes harder to use.
How to Draw Fibonacci
Decide Which Swing to Draw On
Draw on one clear swing that recently made a new high or low. If you draw in the middle of many small ups and downs, you will struggle to decide which low and high to use.
If you are unsure, check the swing on the next higher timeframe. For example, if you are unsure on the 15-minute chart, look at the 1-hour chart; if unsure on the 1-hour chart, look at the 4-hour chart, and choose the prominent low and high there.
In an Uptrend, Draw from Low to High
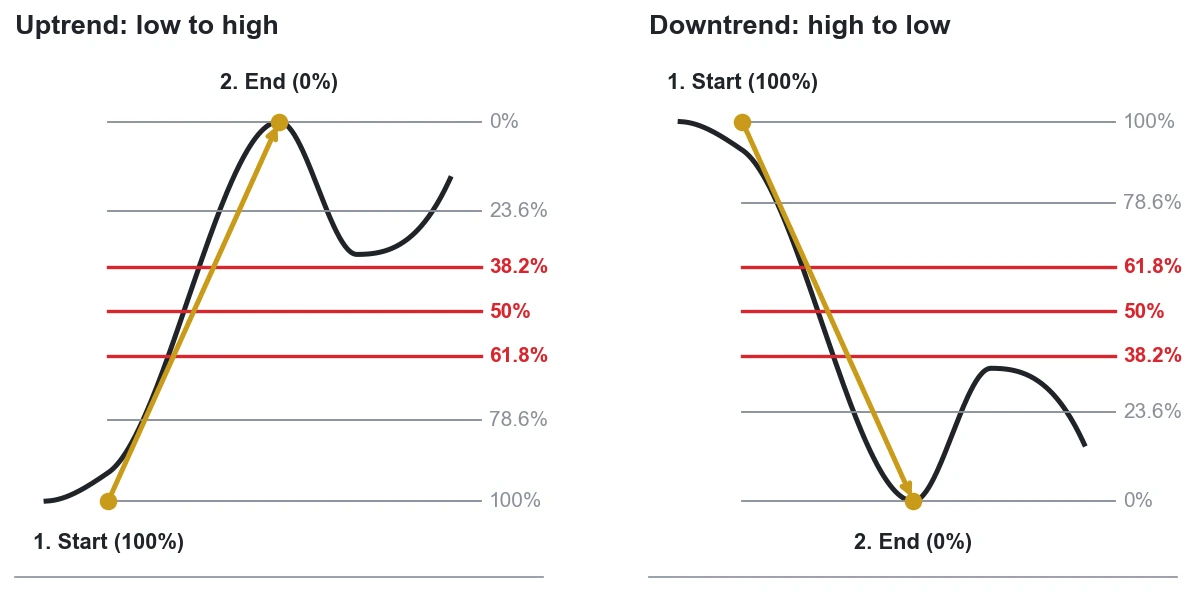
When looking for a pullback in an uptrend, click the low at the start of the swing and drag straight to the high.
In MT5, the point where you start drawing becomes 100% and the point where you finish becomes 0%. In an uptrend, the low is 100% and the high is 0%, with the 38.2% and 61.8% lines between them.
In a Downtrend, Draw from High to Low
When looking for a guide for selling on a rally in a downtrend, draw the other way, from the high to the low. The high is 100% and the low is 0%, and the retracement guides appear going up from the low.
If you draw in the opposite direction, the positions of 38.2% and 61.8% swap. After drawing, check which side 0% and 100% are on.
Align with the Tips of the Wicks
Align the high and low with the tips of the wicks, not the candlestick bodies. The high and low of a candlestick are the prices at the tips of its wicks.
Horizontal lines such as the previous day's high and low are also drawn at these prices. If you align with the wick tips, you can check whether the Fibonacci lines and the horizontal lines overlap using the same standard.
Some people draw to the bodies. In that case too, draw to the same standard every time.
Steps to Draw Fibonacci in MT5
Select from the Menu
From the top menu of MT5, select "Insert" (「挿入」) → "Objects" (「オブジェクト」) → "Fibonacci" (「フィボナッチ係数」) → "Fibonacci Retracement" (「フィボナッチリトレースメント」).
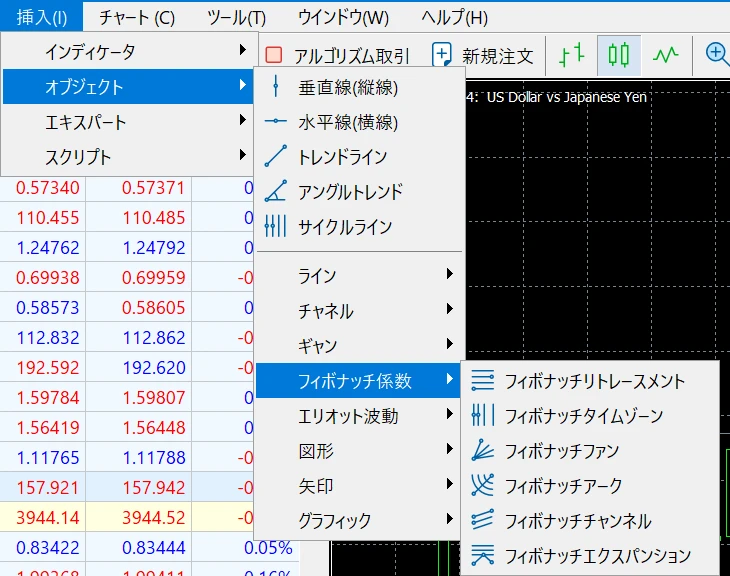
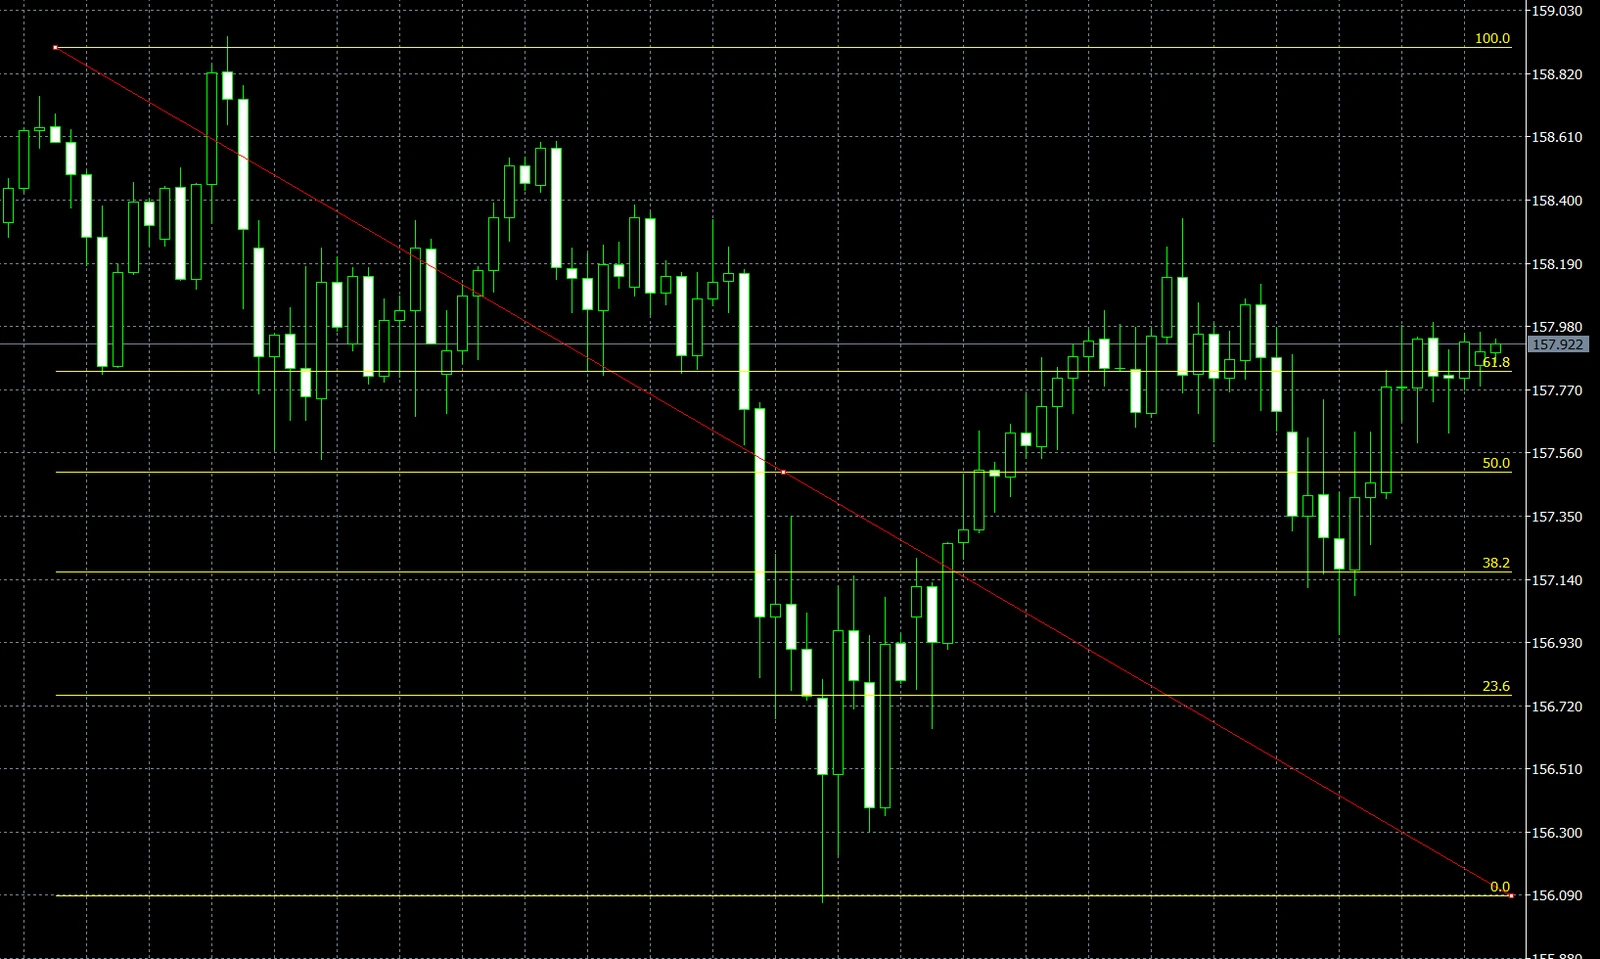
After selecting it, click the low on the chart, hold the button down, drag to the high, and release. The image below is an example drawn on a downward swing from the high to the low, with the starting high at 100.0 and the ending low at 0.0.
Set the Position by Number
Right-click the Fibonacci lines you drew and select "Properties" (「プロパティ」) at the top to open the settings window.
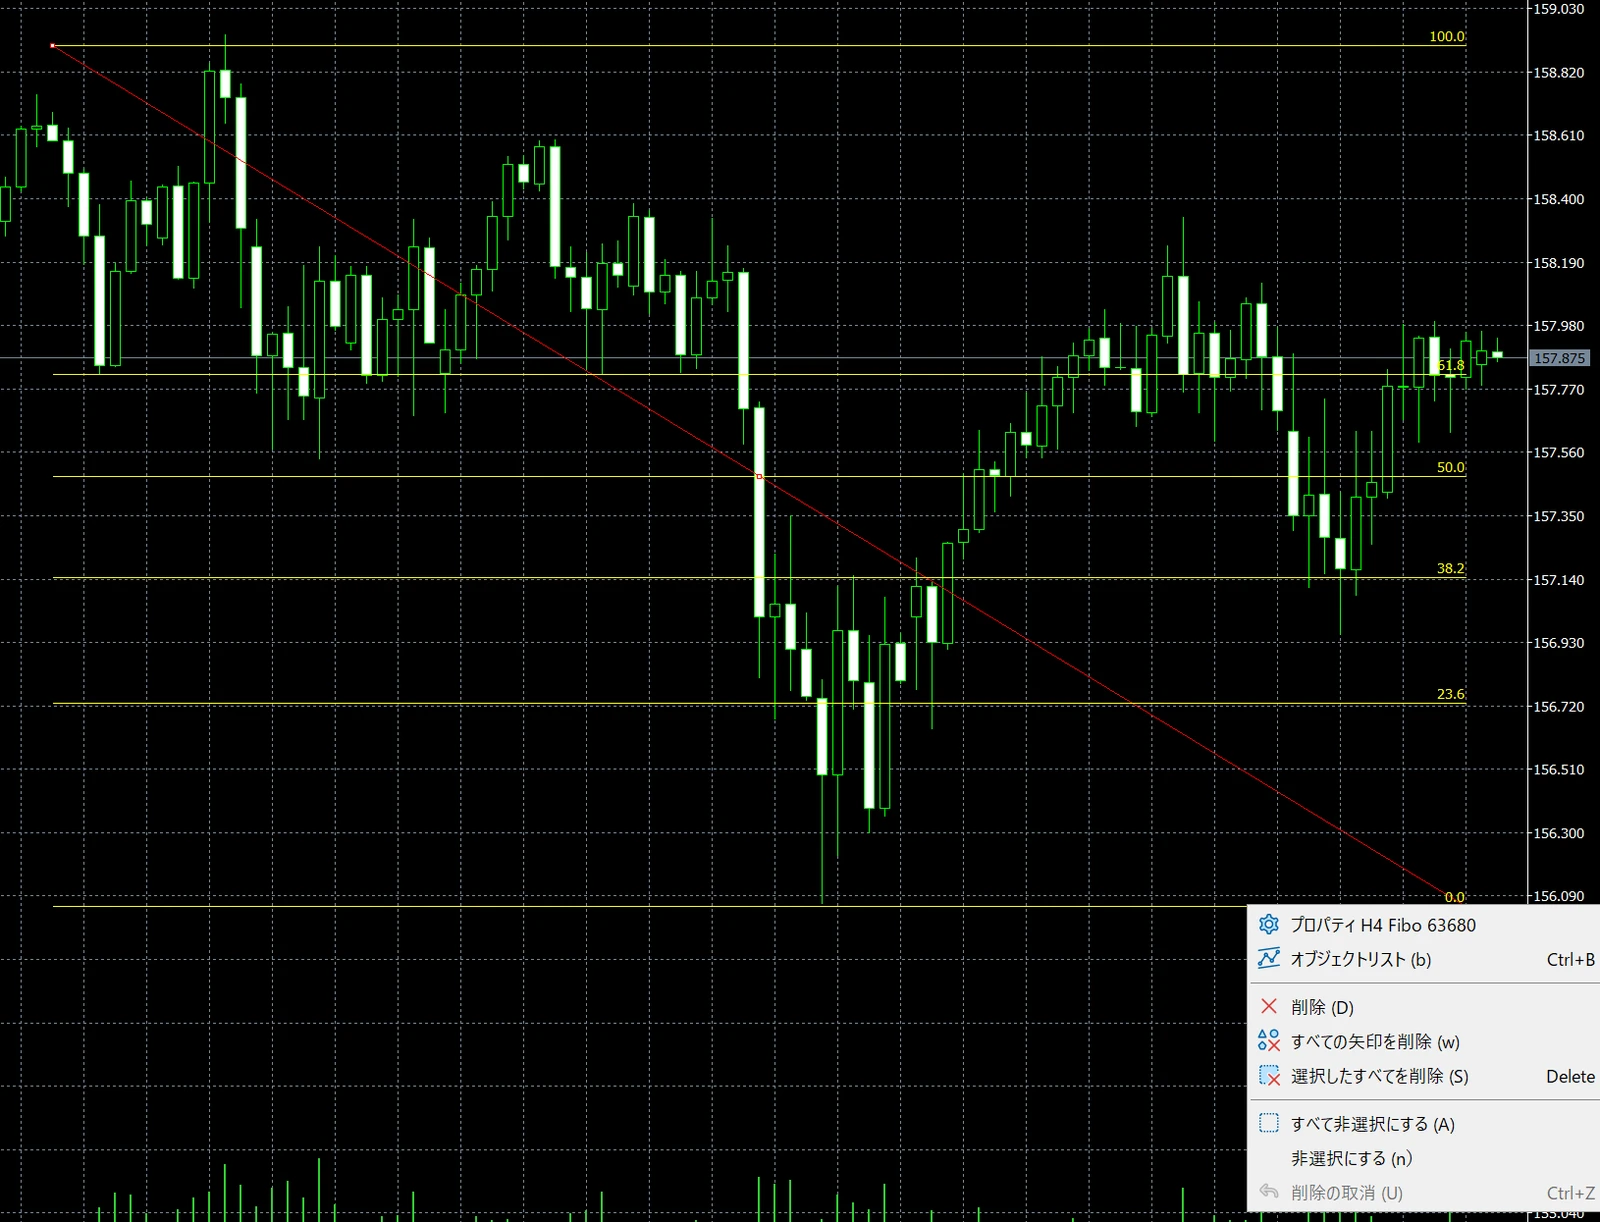
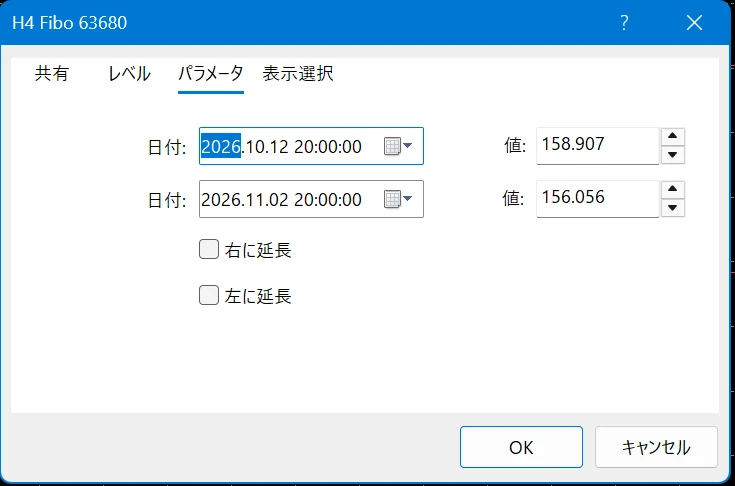
The "Parameters" (「パラメータ」) tab of the settings window lists the dates and prices of the start and end points. If you enter prices directly, you can align exactly with the high and low at the wick tips.
Adding and Color-Coding Levels in MT5
The settings window has four tabs, "Common" (「共有」), "Levels" (「レベル」), "Parameters" (「パラメータ」) and "Visualization" (「表示選択」), and you change the levels shown and the line color in the "Levels" (「レベル」) tab.
Add the 78.6% Level
The default levels in MT5 are 0%, 23.6%, 38.2%, 50%, 61.8%, 100%, 161.8%, 261.8% and 423.6%, and 78.6% is not included.
In the "Levels" (「レベル」) tab, press "Add" (「追加」), then enter 0.786 in the Level column and 78.6 in the Details column.
In the Level column, enter values as decimals, such as 0.236 for 23.6%. The text you enter in the Details column is displayed next to the line on the chart.
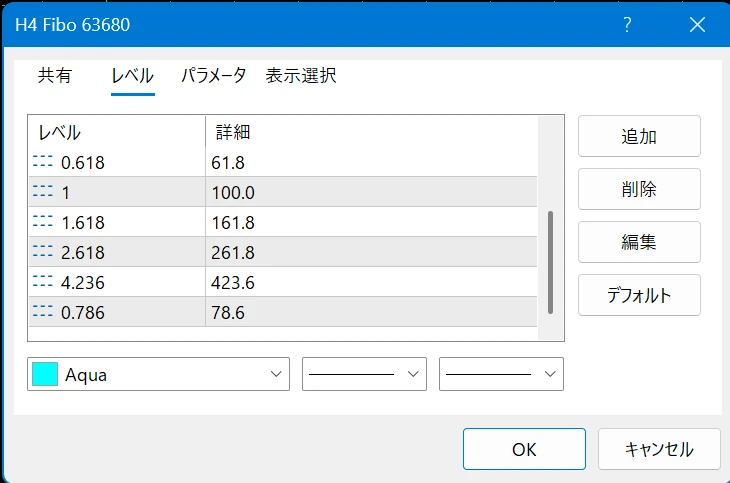
An added level goes to the end of the list. For levels you do not use, such as 161.8%, select the row and press "Delete" (「削除」) to make the chart easier to read.
Display the Price of Each Level
If you enter "%$" in the Details column of the "Levels" (「レベル」) tab, the price of that level is displayed next to the line. For example, if you set the details to "61.8 %$", the text 61.8 and the price of that level are displayed side by side.
If the prices are displayed, you can enter the price for a limit order or stop loss directly on the order screen.
Line Color Is Shared by All Levels
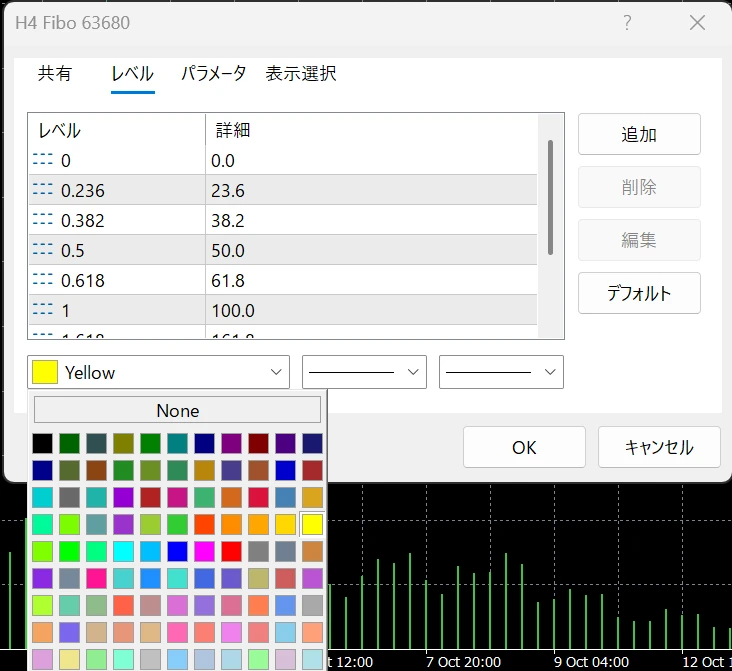
You can choose the line color in the color field below the "Levels" (「レベル」) tab. However, there is only one color field, so the color you choose applies to the lines of all levels.
Overlay Two to Color-Code
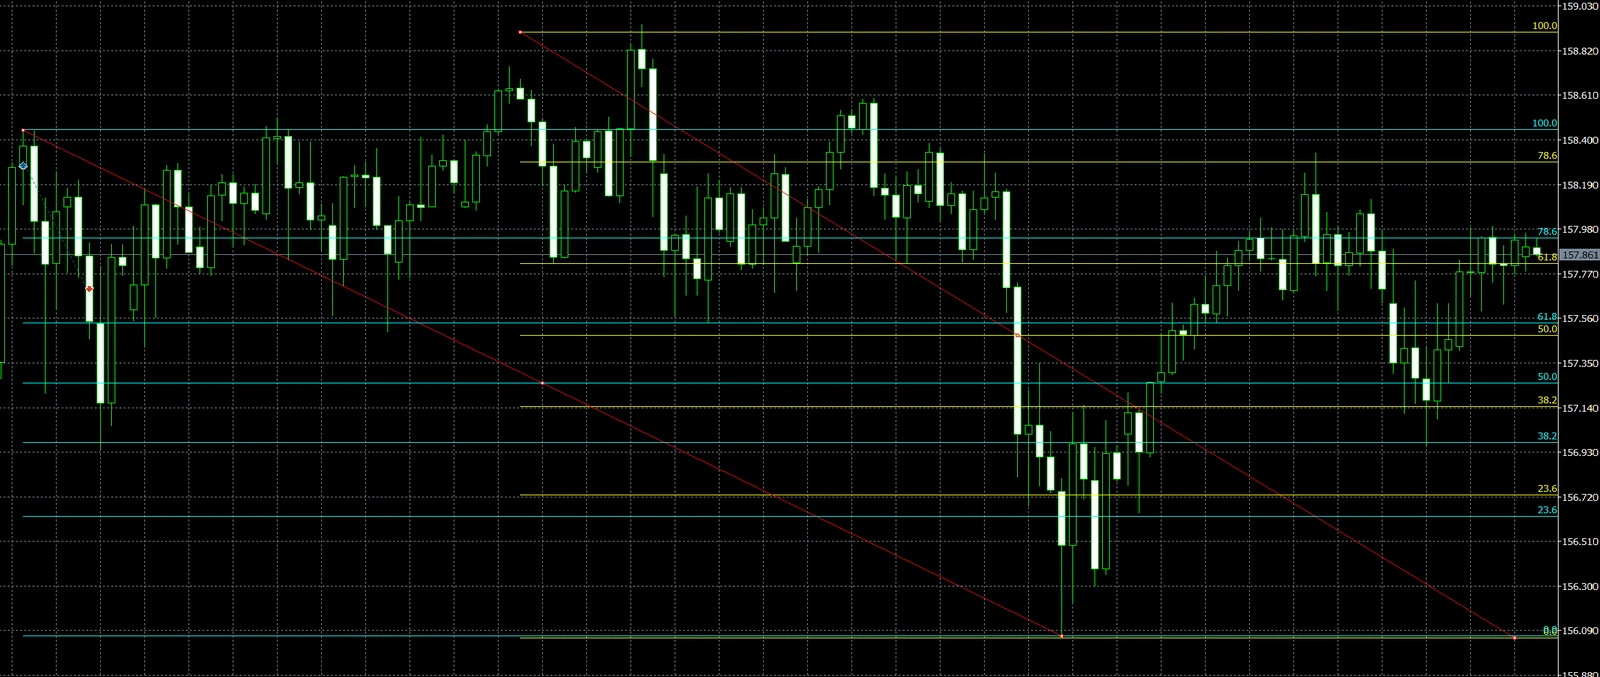
If you want to highlight only 38.2%, 50% and 61.8%, draw two Fibonacci tools on the same high and low. The color can be set for each Fibonacci tool, so if you split the levels between two tools, you can display them in two colors.
For the first one, keep only 38.2%, 50%, 61.8% and 78.6% and set it to red; for the second, keep only 0%, 23.6% and 100% and set it to yellow. For the start and end points of the second one, enter the same dates and prices as the first in the "Parameters" (「パラメータ」) tab, and they will overlap exactly.
The image below is an example of two Fibonacci tools drawn on separate swings, displayed in yellow and light blue.
Extend to the Right
If you check "Extend right" (「右に延長」) in the "Parameters" (「パラメータ」) tab, the level lines extend to the right edge of the chart.
If you do not extend them, the lines are shown only between the start point and the end point. If you want to check the levels after price has moved past that range, extend them.
Deciding Stop Loss and Take Profit from the Levels You Drew
Once you have decided your entry level with Fibonacci, you can decide the stop loss and take profit positions from the same lines.
Place the Stop Loss Outside the Next Level
If you buy at 61.8%, place the stop loss slightly below 78.6%. This is because if price breaks below 78.6%, it has been pushed back to just above the starting low (100%), and the grounds for seeing it as a pullback become weaker.
Stop loss guide for each entry level, and the ratio when taking profit at 0%
| Entry level | Stop loss guide | Ratio when taking profit at 0% |
|---|---|---|
| 38.2% | Slightly outside 50% | About 1:3.2 |
| 50% | Slightly outside 61.8% | About 1:4.2 |
| 61.8% | Slightly outside 78.6% | About 1:3.7 |
The ratio is calculated by dividing the entry level's % by the difference to the next level. For every level, the ratio is the same regardless of the size of the swing.
However, these figures assume the stop loss is placed exactly at the next level. In practice, you leave a margin of a few pips so that a wick does not trigger your stop loss, so the ratio will be smaller than this.
Even with a large ratio, if you are stopped out often, your profit and loss will be negative. Do not decide trades on the ratio alone.
Calculating with USD/JPY
Let's calculate a case where USD/JPY rises from ¥150.00 to ¥152.00 and you buy at 61.8%. The price of each level is as follows.
61.8%: ¥152.00 − (¥2.00 × 61.8%) = ¥150.764
78.6%: ¥152.00 − (¥2.00 × 78.6%) = ¥150.428
If you place the stop loss at ¥150.398, 3 pips below 78.6%, the stop loss width is 36.6 pips. If you place the take profit at ¥152.00, the take profit width is 123.6 pips.
Take profit width ÷ stop loss width = 123.6 pips ÷ 36.6 pips ≈ 3.4
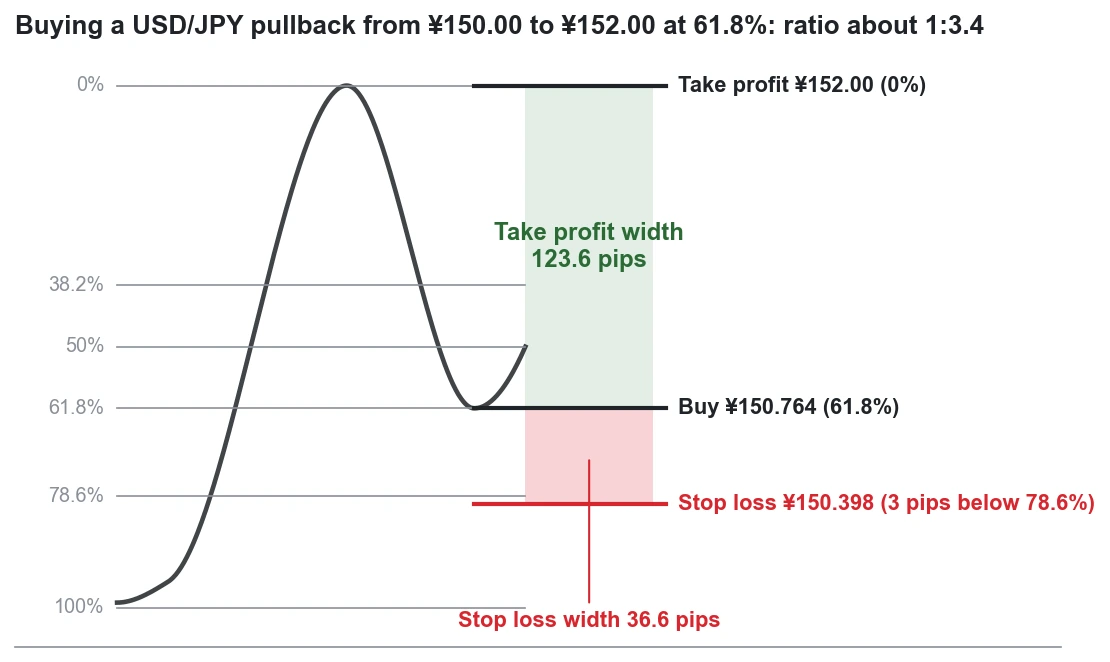
From the about 1:3.7 in the table, the ratio drops by the amount of the added margin, to about 1:3.4. If you place the take profit slightly short of the high, the ratio becomes smaller still.
When selling in a downtrend, swap the high and low and calculate in the same way.
Deciding Lot Size from the Stop Loss Width
Once the stop loss width is decided, you can calculate the lot size from the loss amount per trade.
If you have ¥100,000 in capital and want to limit the loss per trade to 2%, or ¥2,000, divide ¥2,000 by the stop loss width per unit of currency, ¥0.366.
¥2,000 ÷ ¥0.366 ≈ 5,464 units of currency
For an account where 1 lot is 100,000 units, rounding down to 0.01 lot steps gives 0.05 lot. If the stop loss is hit, the loss is about ¥1,830.
Even at the same 61.8%, the larger the swing, the wider the stop loss width and the smaller the lot size you can hold. If you want to know more about deciding the loss amount and calculating lot size, check the article below!
Use the Previous High as a Guide for Take Profit
The guide for taking profit is the high (0%) before the pullback formed. Because selling can increase just before the high, some people place it slightly short of the high instead of exactly at it.
After subtracting the spread, the actual ratio is smaller than the ratio on the chart. If you want to calculate the effective ratio after costs, check the article below!
When You Are Unsure About a New High or Timeframe
Redraw When a New High Is Made
If an uptrend makes a new high, move the end point to the new high and redraw. If you leave it at the old high, the lines will stay at positions shallower than the actual pullback.
Conversely, if price breaks below the low (100%), you can judge that the upward swing has ended. Delete that Fibonacci and look for a new swing.
Change the Color for Each Timeframe
Lines drawn on the 1-hour chart show the same prices when viewed on the 5-minute chart. If you draw on several timeframes, you will lose track of which line belongs to which swing.
If you decide a line color for each timeframe, such as yellow for the 4-hour chart and light blue for the 1-hour chart, they are easier to tell apart.
Where the Daily Candle Starts Differs by Broker
The times on an MT5 chart are the broker's server time. A daily candle starts at 0:00 server time, so between brokers with different server times, the high and low of the daily candle can differ.
When you draw on the daily chart, check the server time of the account you use, and it will be easier to compare with lines drawn by others.
Using EdgeGraph FX's MT5
On EdgeGraph FX's MT5 too, you can draw Fibonacci retracement with the steps in this article. It is a standard drawing tool, so no additional installation is needed.
EdgeGraph FX's MT5 server time is 6 hours behind Japan time during US daylight saving time, and 7 hours behind the rest of the year. As a result, the daily candle changes over at 6 a.m. or 7 a.m. Japan time.
If you want to know more about the dates when daylight saving time and standard time switch, and how MT5's time changes accordingly, check the article below!
When looking for prices that overlap with Fibonacci levels, you can also use the indicators we distribute for free. They can automatically draw horizontal lines at the previous day's high and low and at round-number prices, so you can check on the chart whether they overlap with the Fibonacci lines.
If you want to see the list of distributed indicators and how to use them, check the article below!
Frequently Asked Questions
Summary
Fibonacci lets you decide not only where to enter but also the level for your stop loss from the same lines. Once the stop loss width is decided, you can even calculate the lot size from the loss amount per trade.
With EdgeGraph FX's MT5, in addition to the standard Fibonacci, we distribute for free an indicator that draws horizontal lines at the previous day's high and low and at round-number prices.
You can also start by drawing Fibonacci on a demo account and trying out adding levels and splitting them into two colors.
With an EdgeGraph FX demo account, you can try Fibonacci settings and placing orders
Learn how to start a demo account here!