What Is RCI Divergence? How to Spot It, Avoid False Signals, and How It Differs from RSI
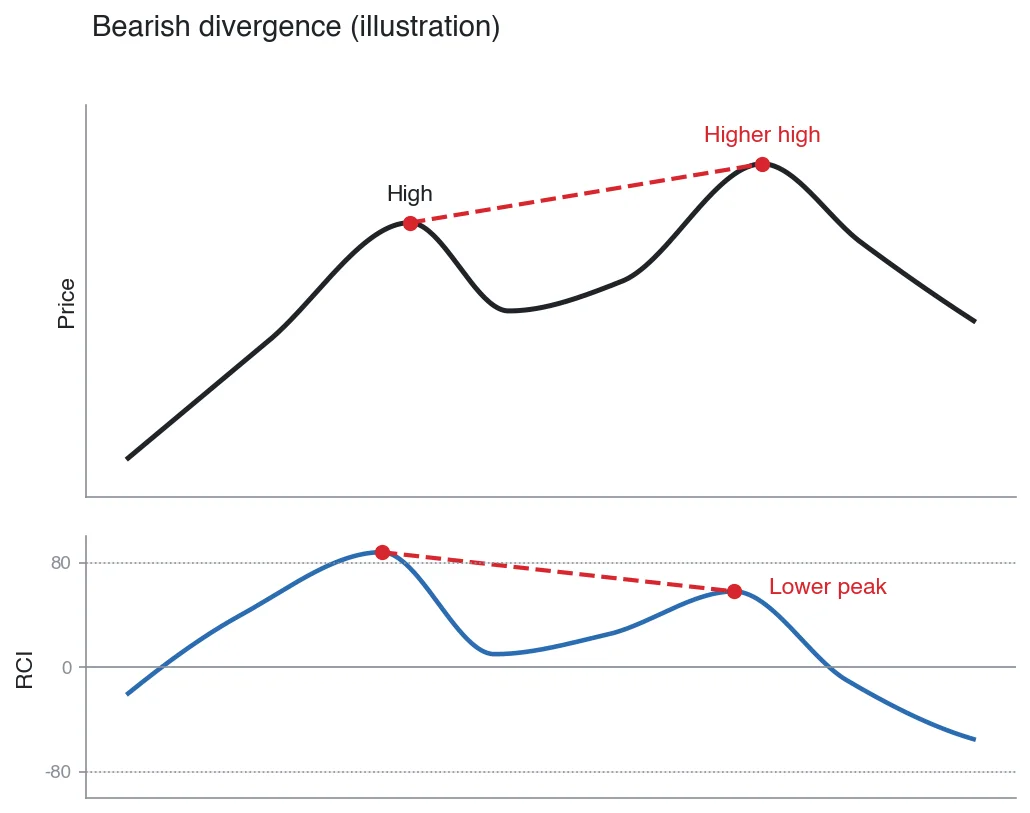
RCI divergence is when price makes a higher high while the RCI makes a lower peak, or when price makes a lower low while the RCI makes a higher trough.
However, the RCI is calculated from ranks rather than from the size of price moves, so reading it the same way you read the RSI can lead you astray.
In this article, we use a worked example to show how divergence appears on the RCI, then explain how to choose the line, how to pick peaks and troughs, which conditions tend to produce false signals, and how it differs from the RSI.
Table of Contents
- What Is RCI Divergence?
- The RCI Moves on Ranks, Not Price Ranges
- How to Spot RCI Divergence
- Three Conditions That Often Lead to False Signals
- Wait for the Reversal After Spotting Divergence
- How RSI and RCI Divergence Differ
- Detecting Divergence with the EdgeGraph FX Indicator
- Frequently Asked Questions
- Summary
What Is RCI Divergence?
RCI divergence is when price and the RCI move in opposite directions. It is used as a sign that the price trend may be starting to change.
The RCI is an indicator that measures how closely the time ranking and the price ranking of closing prices match over a set period.
Its value moves between -100 and +100. The more steadily price keeps rising, the closer it gets to +100, and the more steadily price keeps falling, the closer it gets to -100.
Bearish Divergence
Bearish divergence is when price breaks above the previous high, but the RCI peak is lower than the previous peak.
Even if the uptrend still looks intact, this is a point to watch for the end of the rise.
Bullish Divergence
Bullish divergence is when price breaks below the previous low, but the RCI trough is higher than the previous trough.
This is a point to watch for the end of the decline. In either case, the market does not necessarily reverse just because divergence appears.
The RCI Moves on Ranks, Not Price Ranges
The RCI does not use the size of price gains or losses in its calculation.
It ranks the bars in the period by time and by price, and calculates its value from the gap between those two rankings. So as long as the order is the same, the RCI gives the same value even if the size of the moves differs.
Different Pullback Depths, Same RCI
For example, let's compare the following two price paths using a 9-period RCI. The only difference is the close of the sixth bar.
Case 1: 100, 110, 120, 130, 140, 139, 150, 160, 170
Case 2: 100, 110, 120, 130, 140, 131, 150, 160, 170
In Case 1, the sixth bar dips by just 1. In Case 2, it dips by 9.
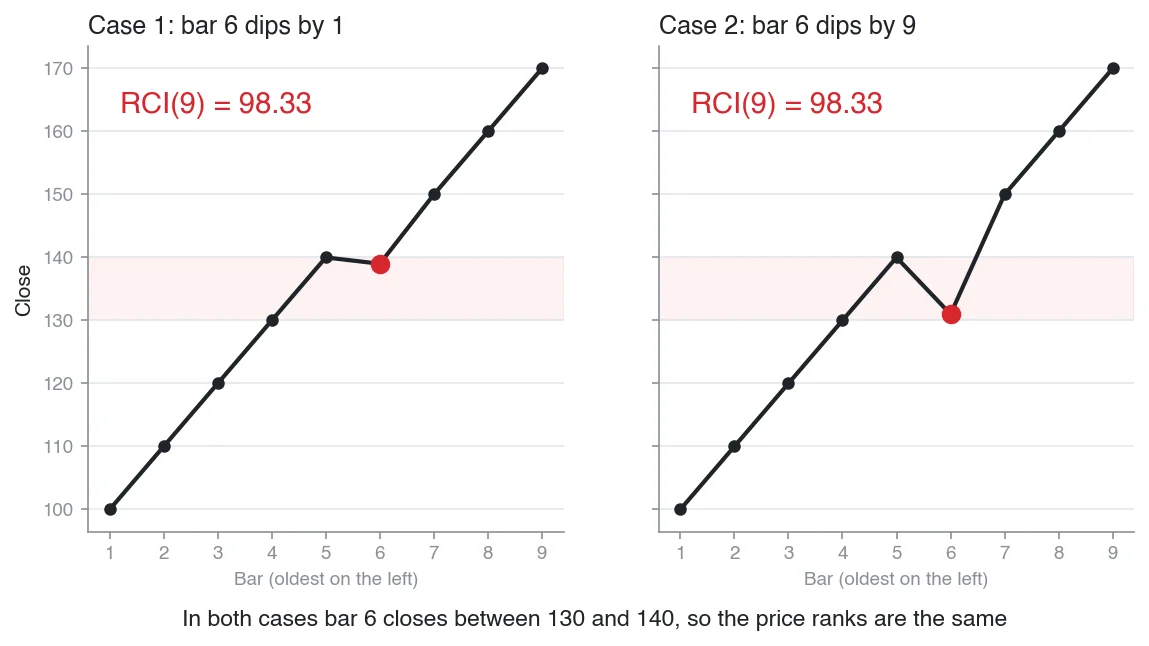
In both cases the sixth bar closes between 130 and 140, so the price ranks are the same. The sum of the squared rank differences is 2 in both cases, and the RCI is calculated as follows.
RCI = (1 − 6 × 2 ÷ (9³ − 9)) × 100 = 98.33
Even though the pullback is nine times deeper, the RCI is 98.33 in both cases.
The RSI, on the other hand, is calculated from the ratio of gains to losses, so it comes out lower for Case 2, where the pullback is deeper.
If the pullback in Case 2 drops below 130 to 125, one more pair of price ranks swaps, and the RCI falls to 95.00. The RCI falls not when the pullback gets deeper, but when more ranks change places.
Divergence Shows a Break in the Order
Because of this, RCI divergence shows less that "upward momentum has weakened" and more that the orderly rise or fall has started to break down.
The RSI falls simply when gains shrink, so divergence can appear even while price is still making new highs.
The RCI, by contrast, does not make a lower peak as long as the order of closes holds, even if gains shrink. As a result, there are times when the RSI shows divergence but the RCI does not.
No Difference While Pinned at +100
As long as every close in the period is higher than the one before, the RCI stays at +100, whether the gains are large or small.
If you compare two highs in this state, the RCI cannot go above 100, so no difference shows up.
Reaction Speed Depends on the Period
The RSI is commonly used with a 14 period, and the short-term RCI with a 9 period.
The shorter the period, the faster an indicator reacts to recent price moves, so you cannot say which one is faster when the periods differ. When comparing divergence on the RSI and the RCI, it is a good idea to use similar periods.
How to Spot RCI Divergence
There are three key points for spotting RCI divergence.
1. Choose the Line That Fits the Swing
If you display three RCI lines, use the line that shows a clear RCI peak for each of the two highs you want to compare.
The 9-period short line forms peaks and troughs on small swings of a few to a dozen or so bars, while the 26-period middle line reacts to larger swings.
The 52-period long line moves smoothly, and its peaks on small swings are not clear. It is better used to check the direction of the larger trend than to look for divergence.
2. Match Price and RCI Peaks and Troughs
A swing high is a bar that is higher than several bars on each side. A swing low is the opposite: a bar lower than several bars on each side.
Take the RCI peak from the same bar as the price high, or from a few bars around it. If you compare an RCI peak from a different period, you will mistake something that is not divergence for divergence.
Compare the two most recent highs, or the two most recent lows. If there is another high in between, check the order including that high as well.
3. Judge on Closed Bars
A high is not confirmed until the bars to its right are in place. Wait until the set number of bars has formed to the right of the second high before you judge.
While a bar is still forming, the RCI value keeps moving until the close is fixed. Decide whether there is divergence only after the bar has closed.
Three Conditions That Often Lead to False Signals
Even after RCI divergence appears, price can keep making new highs or lows. Divergence is especially likely to be a false signal under the following three conditions.
1. The Long RCI Is High and Pointing Up
Even if the short RCI shows divergence, the larger uptrend is still intact if the long RCI is high and pointing up.
The short-term divergence only reflects a pullback in a small swing and does not necessarily mean the larger trend is turning.
2. The RCI Is Pinned Near ±100
While the RCI is pinned, peaks and troughs show no difference in height, so it is easy to mistake a tiny difference in value for divergence.
Wait until the RCI moves off the extreme and forms a clear peak or trough before comparing.
3. A Single Bar Moved Sharply on Economic News
When a single bar moves sharply, for example on an economic data release, that one bar can set the price high.
Because the RCI does not use price ranges, the RCI peak does not rise to match even if the price high stretches far. It can look like divergence even though the order has not broken down.
Wait for the Reversal After Spotting Divergence
Even when you spot divergence, one approach is to hold off on trading right away and wait for price or the RCI to actually start turning.
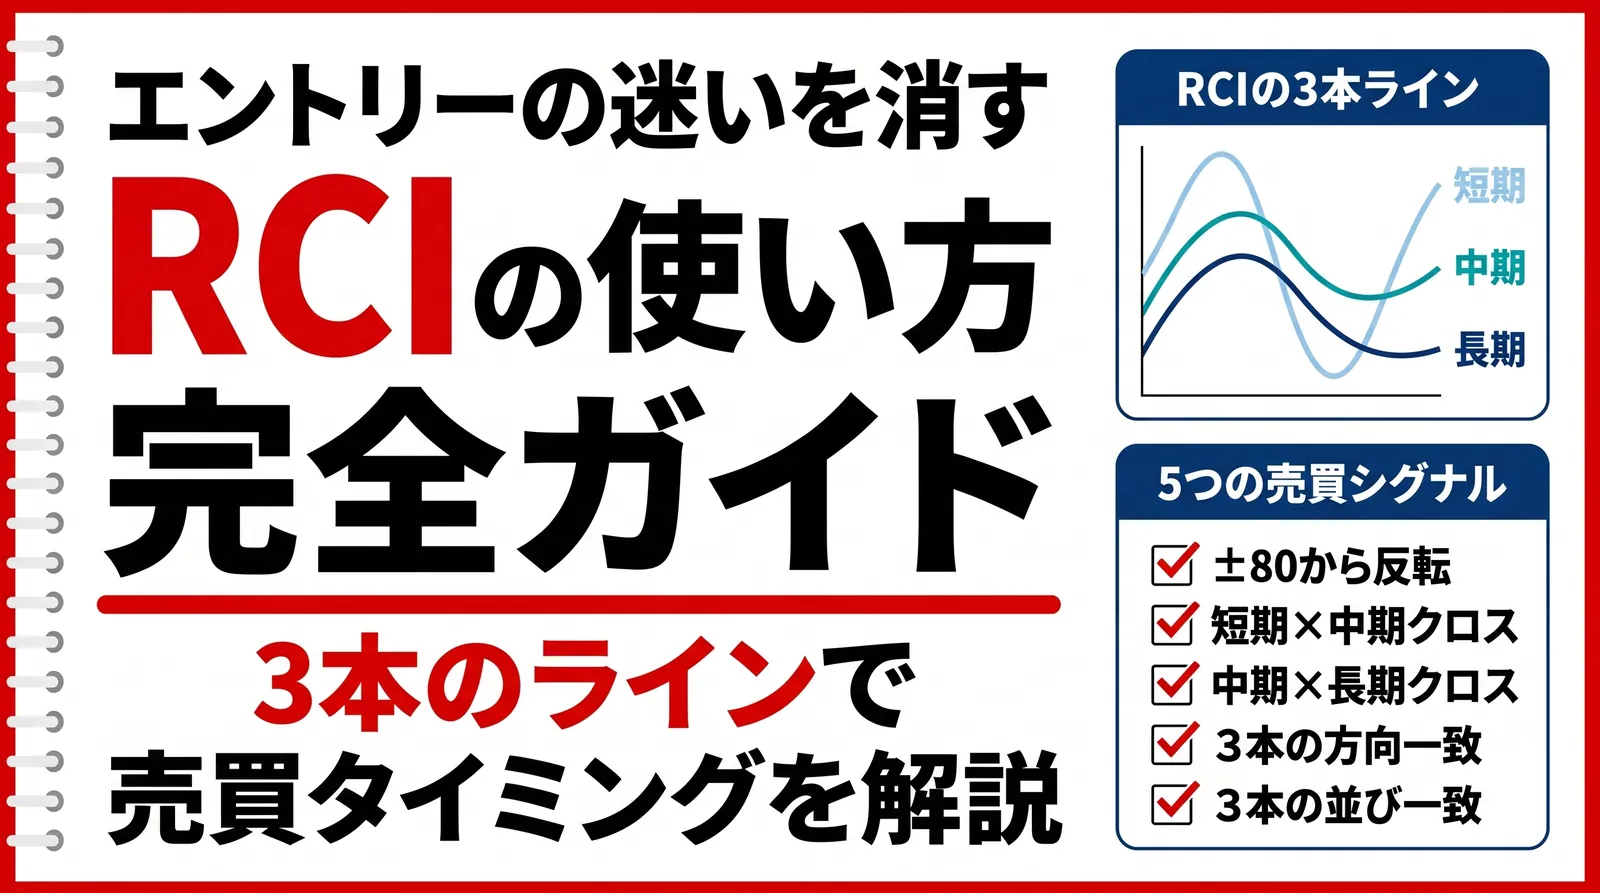
For bearish divergence, one cue is the short RCI dropping below +80. For bullish divergence, wait for the short RCI to rise above -80.
Another cue is price falling below the low between the two highs. For bullish divergence, the cue is price rising above the high between the two lows.
Whichever cue you use, decide where to place your stop loss before you act.
How RSI and RCI Divergence Differ
The main difference between the RSI and the RCI is whether they look at the size of price moves or at their order.
How the RSI and RCI Differ in Calculation and Divergence
| Point of comparison | RSI | RCI |
|---|---|---|
| What it is calculated from | Gains and losses | Time and price ranks |
| Range | 0 to 100 | -100 to +100 |
| Typical period | 14 | 9, 26 and 52 (three lines) |
| Overbought/oversold levels | 70 and 30 | +80 and -80 |
| What divergence shows | Shrinking gains or losses | A break in the order of closes |
The RSI reflects fading momentum directly, so you can notice divergence early, even partway through a rise. On the other hand, it can show divergence many times while the rise continues.
RCI divergence appears after a pullback has broken the order of closes. You can use the RSI when you want to see fading momentum, and the RCI when you want to see whether the order of closes has broken down.
If you want to use an indicator that detects RSI divergence automatically, check out the article below!
Detecting Divergence with the EdgeGraph FX Indicator
EdgeGraph FX distributes an RCI indicator for MT5 free of charge. It works only with EdgeGraph FX's MT5.
It can display three RCI lines (short, middle and long), with default periods of 9, 26 and 52.
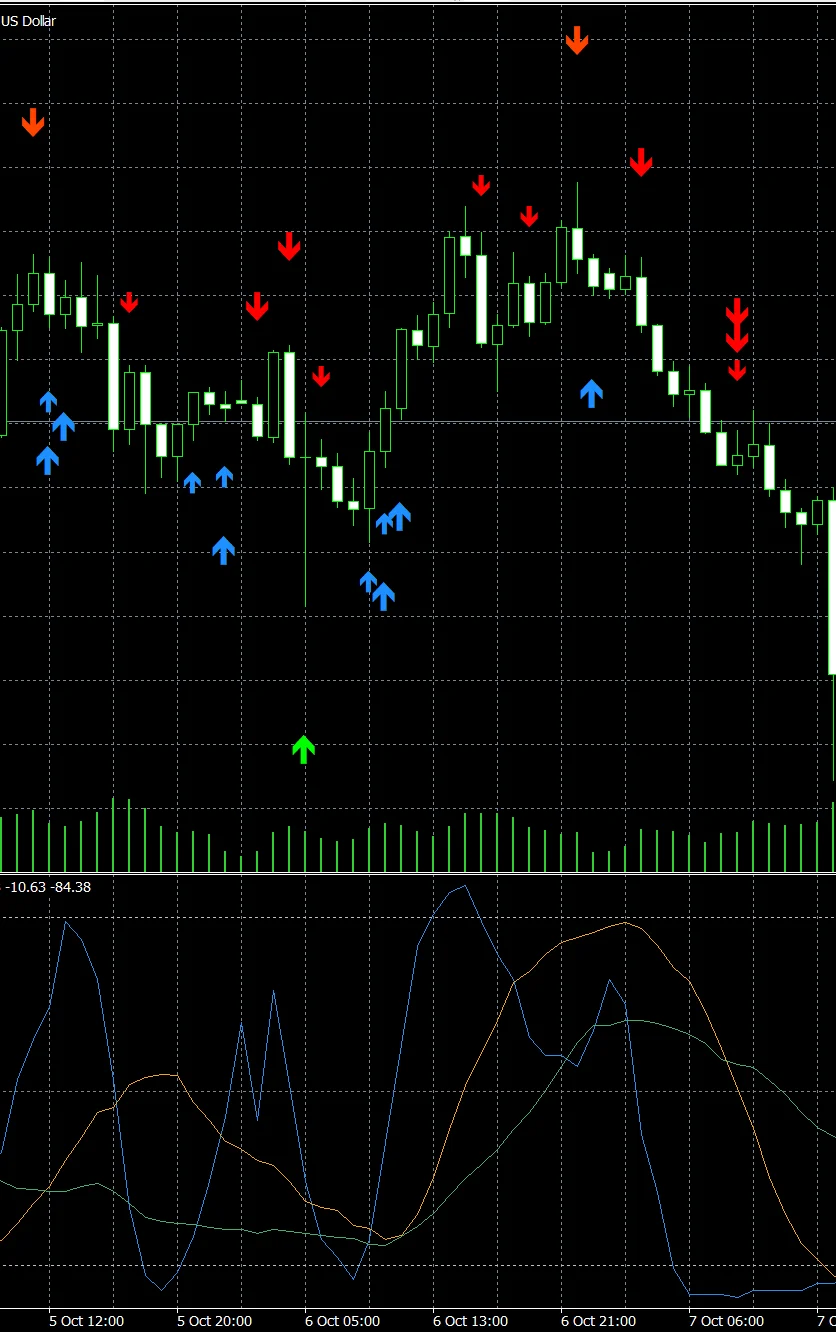
This indicator can detect divergence between price and the RCI and show a signal on the main chart. On the chart, signals appear on bars where the price high or low and the short RCI peak or trough diverge.
Divergence detection is off by default. To use it, go to the Inputs tab in the settings window and change Enable Bullish Divergence and Enable Bearish Divergence from the default false to true.
Peaks and troughs are identified using Pivot Confirmation Bars (each side). This setting specifies the number of candles on each side, and its default value is 3.
The signal is shown at the bar that formed the peak or trough. However, a peak or trough is not identified until the bars to its right are in place.
Signals are Lime for bullish divergence and OrangeRed for bearish divergence.
Alerts are switched with Alert on Bullish Divergence and Alert on Bearish Divergence. Both default to true, but no alerts are sent unless detection is turned on.
If you want to go through each item in the settings window, check out the article below!
A signal only tells you that the divergence pattern has formed; whether to trade is your own decision. You can check the long RCI's position and whether the lines are pinned using the three lines in the same subwindow.
If you want to learn about the indicator's other signals and how to use it, check out the article below!
Frequently Asked Questions
Summary
RCI divergence shows not price momentum, but that the order of closes has started to break down.
Choose the line that fits the swing you are comparing, and judge on confirmed peaks and troughs. While the RCI is pinned, or while the long RCI is high and pointing up, divergence is more likely to be a false signal.
EdgeGraph FX distributes, free of charge, an RCI indicator that detects divergence and shows signals.
If you want to see how divergence appears on a real chart, try it on an EdgeGraph FX demo account, where you can trade without using real money.
See how RCI divergence appears on an EdgeGraph FX demo account
Learn how to start a demo account here!