Best MT5 Indicators: Free Classics and How to Choose by Purpose
When you open the indicator list in MT5, the built-in indicators alone come to 38. If you are not sure which ones to put on the chart, it is easier to narrow them down by starting with what you want to know.
This article introduces the standard indicators built into MT5 by purpose, then walks through how to choose them, how to avoid overloading your chart, and how to fill in missing features with free indicators.
Table of Contents
- MT5 Indicators Fall into 4 Categories
- Standard Indicators to Choose by Purpose
- Use the Moving Average to See the Market Direction
- See the Range of Price Movement with Bollinger Bands
- Ichimoku Lets You See Multiple Pieces of Information at Once
- Check Overbought and Oversold Conditions with the RSI
- Use the MACD to See Changes in Momentum
- Use the ATR to Measure the Size of Price Movements
- 3 Points for Choosing Indicators
- Do Not Overload Your Chart with Indicators
- Fill in Missing Standard Features with Additional Indicators
- Free Indicators from EdgeGraph FX
- Frequently Asked Questions
- Summary
MT5 Indicators Fall into 4 Categories
The indicators built into MT5 are divided into four categories: 13 Trend indicators, 15 Oscillators, 4 Volume indicators, and 6 Bill Williams indicators.
If you open "Insert" and then "Indicators" from the menu at the top of the chart, the list is displayed by these categories.
Types of MT5 standard indicators and what they show
| Category | What it shows | Representative indicators |
|---|---|---|
| Trend | The direction and range of price movement | Moving Average, Bollinger Bands, Ichimoku |
| Oscillators | Overbought and oversold conditions, momentum, and the size of price movements | RSI, MACD, Stochastic, ATR |
| Volumes | Increases and decreases in trading volume | Volumes, OBV |
| Bill Williams | Market reversals and momentum | Alligator, Fractals |
The Trend and Oscillators categories are the most commonly used.
Many trend indicators are drawn over the candlesticks and are used to see whether the market is heading up or down. Oscillators, on the other hand, are displayed in a separate window below the chart, where you can check numerically whether a move has gone too far and how momentum is changing.
Standard Indicators to Choose by Purpose
Use the Moving Average to See the Market Direction
A moving average is a line that connects the average closing price over a set period.
When the line slopes upward, you can read it as an uptrend, and when it slopes downward, as a downtrend. If you display two lines, one with a short period and one with a long period, the short line crossing the long line from below is called a golden cross, and crossing from above is called a death cross.
See the Range of Price Movement with Bollinger Bands
Bollinger Bands is an indicator that draws bands above and below a moving average to show the range of price movement.
The MT5 default settings are a period of 20 and a deviation of 2, and the price generally moves within these bands.
When the bands narrow and then start to widen, it can be a sign that the market is about to make a large move.
Ichimoku Lets You See Multiple Pieces of Information at Once
With Ichimoku, five lines and a band called the "cloud" let you check the market direction, key levels, and momentum together.
The MT5 default settings are 9, 26, and 52. The basic reading is that when the price is above the cloud, it is an uptrend, and when it is below the cloud, it is a downtrend.
Check Overbought and Oversold Conditions with the RSI
The RSI is an oscillator that shows overbought and oversold conditions as a value from 0 to 100, based on the ratio of price increases to price decreases over a set period.
The MT5 default period is 14, with horizontal lines drawn at 70 and 30. A reading above 70 is a guide for overbought, and a reading below 30 is a guide for oversold.
However, when a strong trend continues, the price may keep rising while the RSI stays above 70. Rather than deciding on a reversal from the number alone, check it together with a trend indicator.
The Stochastic is another indicator that looks at overbought and oversold conditions in a similar way.
Use the MACD to See Changes in Momentum
The MACD looks at changes in market momentum based on the difference between a short-term and a long-term moving average. The MT5 default settings are 12, 26, and 9.
Note that in MT5, the MACD is shown as a histogram (bar chart), and the signal is shown as a line. Because this looks different from the "crossing of two lines" described in general explanations, you watch for the points where the bars cross above or below the line.
Use the ATR to Measure the Size of Price Movements
The ATR lets you check, as a number, the average range of the candlesticks over a set period.
It does not show the market direction, but it can be used when deciding the width of a stop loss.
For example, if you set the stop-loss width in advance based on the ATR value, it becomes easier to avoid being stopped out by a stop loss that is too narrow on a day with large price movements.
3 Points for Choosing Indicators
A larger number of indicators does not make your analysis more accurate. Keep the following three points in mind when choosing.
1. Start from What You Want to Know
First, decide what you want to check on the chart.
Once your purpose is clear, you can narrow the candidates down to 2 to 3. For example, choose a trend indicator if you want to see the market direction, and an oscillator if you want to find the timing for an entry.
2. Combine Trend Indicators and Oscillators
When combining indicators, the basic approach is to choose one from each of the different categories.
For example, you can use a moving average to confirm an uptrend, and then look for a timing to buy when the RSI comes down during the uptrend.
Another approach is to use different timeframes, such as confirming the direction on the 1-hour chart and then looking for the timing on the 5-minute chart.
3. Start with the Default Settings
At first, try using settings such as the period as they are by default.
This is because changing the settings in detail tends to produce values that fit only past charts. Once you are used to reading the indicator, it is a good idea to adjust the values little by little to match the timeframe you trade.
Do Not Overload Your Chart with Indicators
It is a good idea to keep the indicators on your chart to 2 to 3.
For example, even if you display the RSI, the Stochastic, and Williams' %R at the same time, all three are oscillators that look at overbought and oversold conditions, so you would be looking at the same information three times.
In addition, as the number of indicators increases, there are more situations where the signals contradict each other, and it becomes easy to lose track of which one to trust.
Overlapping displays can also make the candlesticks themselves hard to see.
Fill in Missing Standard Features with Additional Indicators
In MT5, in addition to the standard indicators, you can add and use custom indicators made outside of MT5.
The standard indicators cannot automatically find divergence or automatically draw horizontal lines at key levels. When you want features like these, you add free indicators distributed by forex brokers, for example.
What to Check Before Adding One
The files you can use in MT5 are those with the extension ".ex5" or ".mq5". The ".ex4" and ".mq4" files made for MT4 do not work in MT5.
Avoid files from unknown sources, as they may cause problems on your PC.
Also, in the MT5 smartphone app, you generally cannot add custom indicators. Use the indicators you have added in MT5 for PC.
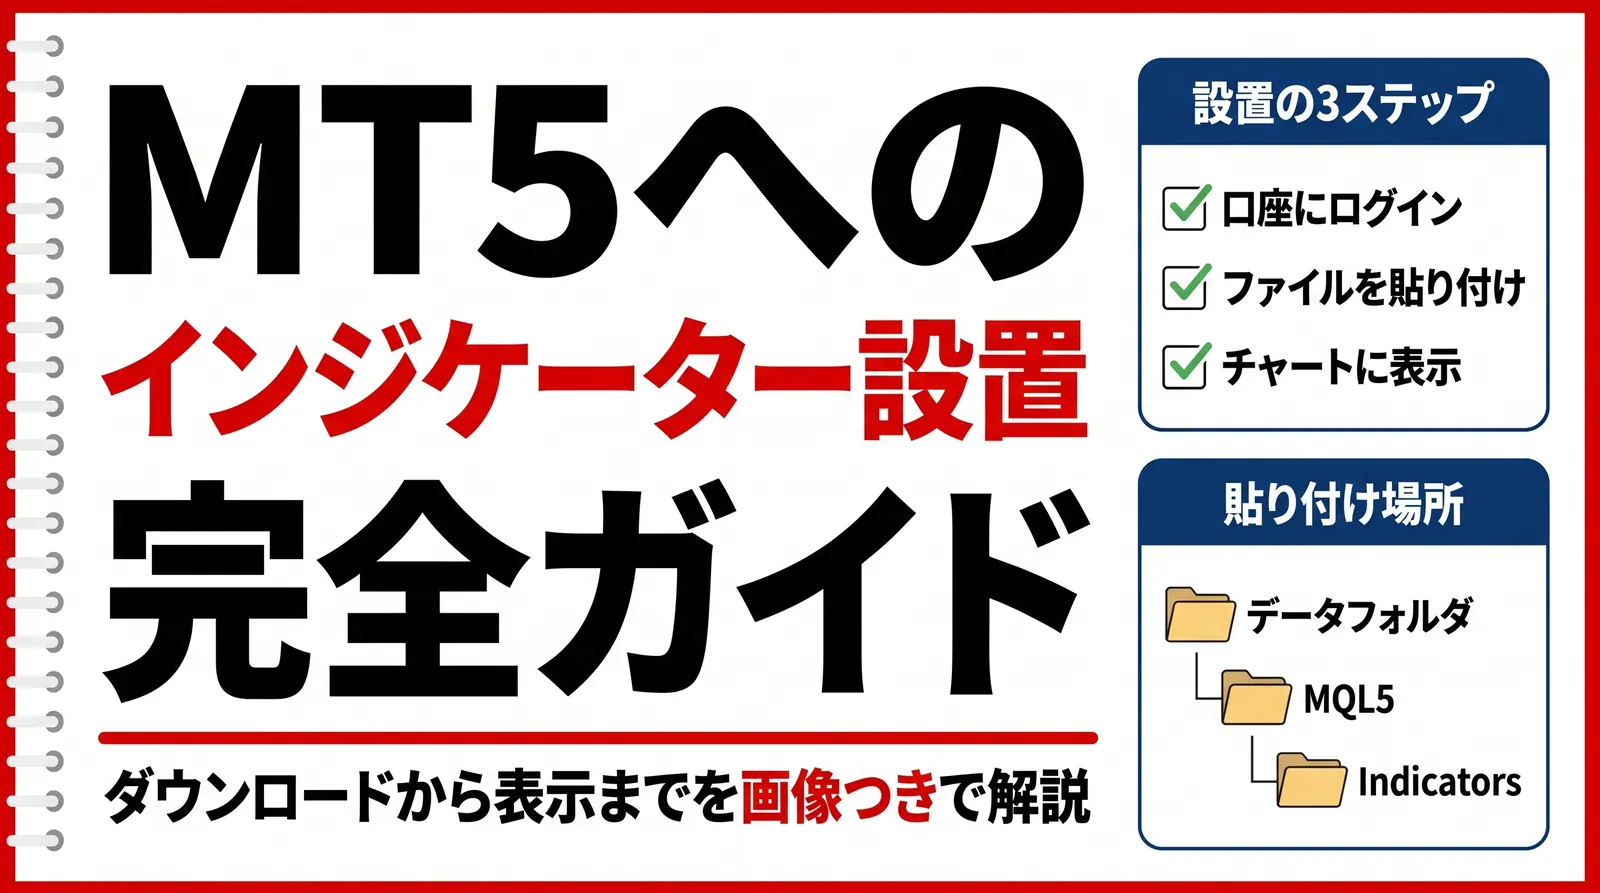
If you want to know how to add indicators to MT5, check the article below.
Free Indicators from EdgeGraph FX
EdgeGraph FX distributes 17 indicators for MT5 for free.
All of them are available from the download page. Please note, however, that the indicators introduced in our guide articles work in MT5 logged in to an EdgeGraph FX account, and do not work in MT5 with another broker's account.
Here, we introduce the distributed indicators by use. Those with a link on the name take you to an article explaining how to use them.
Check the Market Direction
- RCI Triple Signal: Identifies the trend with three RCI lines: short, medium, and long term
- Neo Ichimoku: Automatically detects the three favorable and three unfavorable signals and cloud twists
- Regression Navigator: Analyzes trends, ranges, and overheating with linear regression channels
- Donchian Turtle: Detects breakouts of past highs and lows
- Elliott Wave Counter: Automatically counts impulse waves and corrective waves
Find Entry and Exit Timing
- Neo RSI: Automatically detects RSI divergence
- Neo Bollinger: Adds four features for reading market conditions to the standard Bollinger Bands
- Sakata Goho Patterns: Detects the Three Mountains, Three Rivers, Three Soldiers, Three Gaps, and Three Methods candlestick patterns
- Consecutive Candle Counter: Shows on the chart how many bullish or bearish candles in a row have formed
- SMC_FVG_OB: Automatically draws three elements commonly used in SMC and ICT
Display Key Price Levels
- Prev Day High Low: Automatically displays horizontal lines at past highs and lows
- Round Number Lines: Automatically displays horizontal lines at round-number prices
Check Market Conditions and Trading Results
- Session Highlighter: Color-codes the Tokyo, London, and New York trading hours
- Volatility Index: Shows whether current volatility is high or low
- Chaos Meter: Shows how turbulent the market is from volatility, trend efficiency, and the economic calendar
- Currency Strength Meter: Shows the strength of each currency from the price movements of 28 currency pairs
- Trade Summary Panel: Shows the trading results for the displayed symbol in a panel
In addition, we also distribute two signal tools for day trading gold and other instruments.
We distribute free indicators that can detect divergence and automatically display horizontal lines
Download the free indicatorsFrequently Asked Questions
Summary
Choosing MT5 indicators by what you want to know makes it easier to avoid getting lost. Combine one trend indicator for direction and one oscillator for timing, and try limiting yourself to 2 to 3 indicators.
What the standard indicators cannot do can be filled in with additional indicators. EdgeGraph FX distributes indicators that can detect divergence and automatically display horizontal lines.
First, try a demo account and see how the standard indicators look.
You can try out MT5 operation with an EdgeGraph FX demo account
Learn how to start a demo account here!