RSI vs RCI: Calculation, When to Use Each, and Using Both on MT5
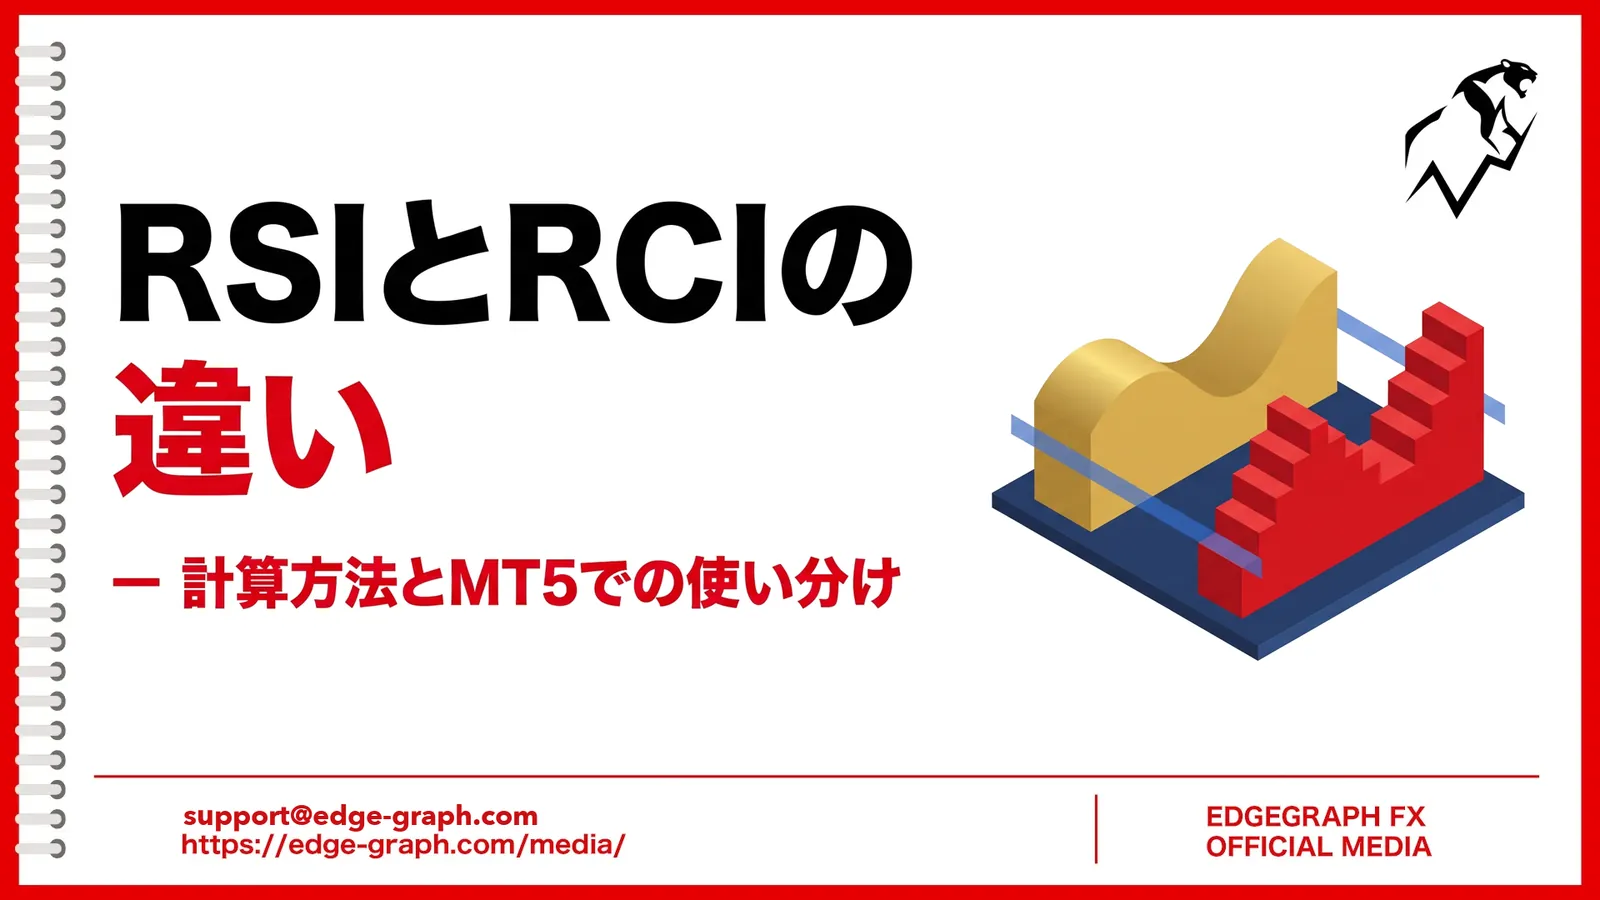
RSI is above 70 and signaling overbought, yet RCI is still pointing up. When you view two oscillators side by side, their readings can sometimes disagree like this.
They disagree because, although both gauge overheating, they use different inputs. RSI uses the size of gains and losses, while RCI uses time rank and price rank.
In this article, we compare the two in order of calculation method, range, period, and the markets they suit, then explain how to choose between them and how to think about viewing them side by side on MT5.
Table of Contents
- The Difference Between RSI and RCI Is What They Use in the Calculation
- Differences in Calculation
- Range and Overheating Guides
- Differences in Period Settings
- Differences in Ranging and Trending Markets
- How to Choose Between Them
- Using RSI and RCI Together on MT5
- Cautions When Using Both
- Frequently Asked Questions
- Summary
The Difference Between RSI and RCI Is What They Use in the Calculation
The difference between RSI and RCI is that RSI uses price range, while RCI uses time rank and price rank in its calculation. The typical ranges and periods differ too, so the same number does not mean the same thing.
Differences between RSI and RCI in calculation, range, and period
| What to compare | RSI | RCI |
|---|---|---|
| What it uses | Average gains and losses | Time rank and price rank |
| Range | 0–100 | -100–+100 |
| Overheating guide | 70 and above / 30 and below | +80 and above / -80 and below |
| Typical period | 14 | 9, 26, 52 |
| Availability on MT5 | Built in | Added separately |
Differences in Calculation
RSI Is Determined by the Ratio of Gains to Losses
RSI compares the average size of gains with the average size of losses over a set period, and expresses on a scale of 0–100 how much of the movement is upward momentum.
RSI = 100 − 100 ÷ (1 + average gain ÷ average loss)
For example, if the average gain is 3 times the average loss,
100 − 100 ÷ (1 + 3) = 75
If gains and losses are equal, RSI is 50.
Because the size of gains and losses goes directly into the formula, even a single bar with a large move can swing the RSI value significantly.
RCI Is Determined by the Gap Between Time Rank and Price Rank
RCI gives each bar in the period two ranks.
For time rank, the most recent bar is ranked 1st; for price rank, bars are ranked in order from the highest closing price.
The following formula turns the gap between these two ranks into a number.
RCI = (1 − 6 × d ÷ (n³ − n)) × 100
Here, n is the period, and d is the sum of the squared differences between time rank and price rank.
With a period of 5, if closing prices are higher the more recent the bar, d is 0 and RCI is +100. Conversely, if closing prices are lower the more recent the bar, d is 40 and RCI is -100.
Only ranks are used in the calculation, and price range plays no part. So if the order of closing prices is the same, RCI gives the same value no matter how many points each bar moved.
Range and Overheating Guides
RSI moves between 0 and 100, with a midpoint of 50. The standard MT5 RSI displays horizontal lines at 30 and 70; above 70 is a guide for overbought, and below 30 is a guide for oversold.
RCI moves between -100 and +100, with a midpoint of 0. Above +80 is considered a guide for overbought and below -80 a guide for oversold, and above 0 is read as an uptrend bias and below 0 as a downtrend bias.
Because the scales differ, you cannot read an RSI of 70 and an RCI of +80 as the same level. Read each by its own guide.
Compared at their standard periods, a period-9 RCI swings more from bar to bar than a period-14 RSI and also reaches the ±80 lines more often.
Differences in Period Settings
A period of 14 is commonly used for RSI.
The shorter the period, the faster it reacts to price movement, and the longer the period, the smoother it becomes.
For RCI, it is common to display three lines with periods of 9, 26, and 52 at the same time. Period 9 is used to see immediate momentum, 26 the short-term flow, and 52 the medium- to long-term flow.
RSI is mainly used as a single line to gauge overheating. RCI, on the other hand, is mainly used by checking whether lines with different periods point in the same direction.
If you want to know how to change the RCI period, check the article below!
Differences in Ranging and Trending Markets
RSI Makes It Easy to Spot Reversals at the Extremes
In a ranging market, RSI tends to reach 70 or 30 at the top and bottom of the range, which makes it an indicator that is easy to use as a guide for reversals.
However, in a strong trend, it can stay above 70. Just because RSI has moved above 70 does not mean price will necessarily pull back.
RCI Makes Direction Easy to Read Even in Small Moves
Because RCI does not use price range, it shows a high value when closing prices keep stepping higher, even if each gain is small.
Its feature is that it makes it easy to tell whether buyers or sellers are in control, even when price movement is small.
On the other hand, when moves in the same direction continue, RCI sticks to +100 or -100, and its value does not change until it moves away from that level. During this time, counter-trend entries from the ±80 lines become less likely to work.
Also, right after a sudden move caused by an economic indicators release, RSI, which uses price range, tends to show the change in value sooner.
How to Choose Between Them
RSI is a clue when you want to see overheating that includes price range, and RCI is a clue when you want to see the direction of the flow from the order of closing prices. Because they look at different things, there will be times when the two disagree when viewed side by side.
When Only RSI Is Above 70
This pattern tends to appear right after large gains. If the long-term RCI line is still pointing up, it may be temporary overheating within an uptrend.
When Only RCI Is Above +80
This pattern tends to appear when closing prices keep rising, even with small gains. If RSI is around 50, price range has not expanded, and only the order of closing prices is lined up.
When Both Show Overheating Together
Both price range and order lean upward, which means the uptrend is strong. However, overheating continues while the trend is strong, so a reversal does not necessarily follow just because both have lined up.
RSI and RCI also differ in how they show moves that run against price. If you want to know how to spot RCI divergence and how it differs from RSI, check the article below!
Using RSI and RCI Together on MT5
MT5 includes RSI as a standard indicator. Drag "Relative Strength Index" from the Indicators list in the Navigator onto the chart, and it appears in a subwindow.
RCI is not included in MT5, so you need to add the indicator separately. With EdgeGraph FX's MT5, you can download an indicator that displays three RCI lines for free.
Once it is added, RSI and RCI appear in separate subwindows, so you can view the two stacked one above the other. The RCI signals are also shown as arrows above the candles on the main chart.
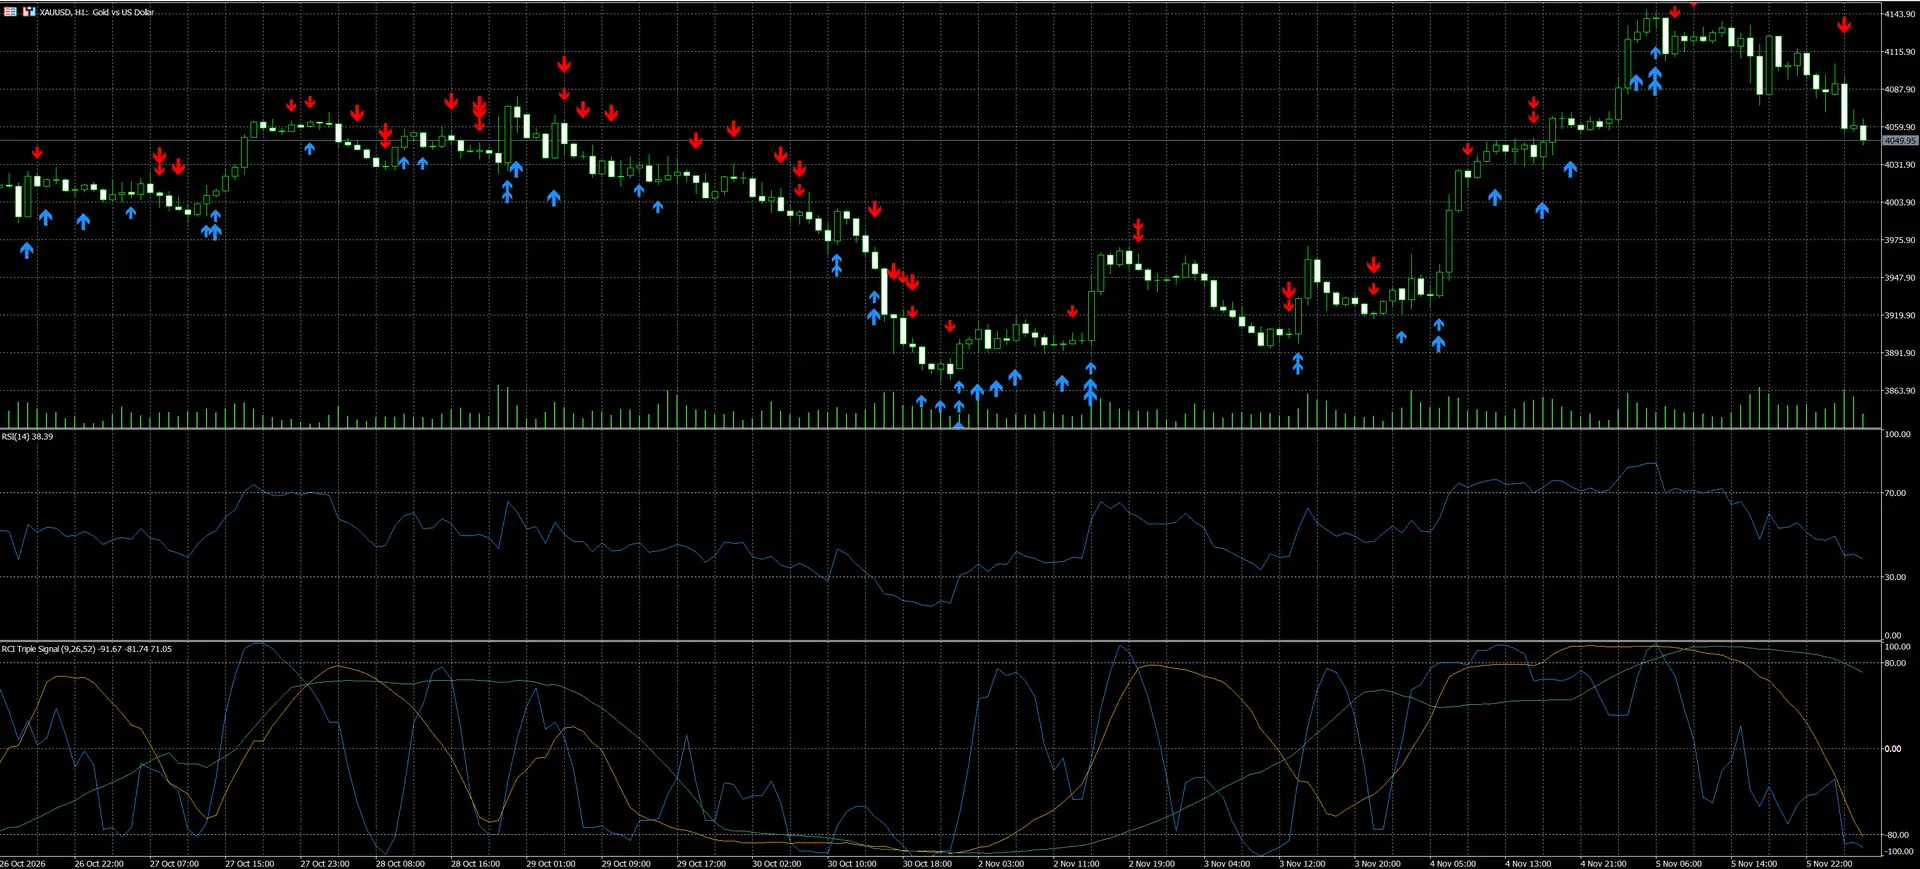
To start, keep both at their default settings and compare how the RSI line and the period-9 RCI line move in the same situations.
If you want to know how to read the three RCI lines and how to choose between signals, check the article below!
Cautions When Using Both
At their standard settings, RSI and RCI are both calculated from closing prices, so even when the two point the same way, that does not mean you have two independent grounds. Make your decision together with the trend direction and recent highs and lows.
Also, there is no single correct period. Adjust it to suit your timeframe and currency pair, and check how it moves with demo trading.
Frequently Asked Questions
Summary
RSI is calculated from price range and RCI from time rank and price rank, so even the same overheating can be read differently. Use RSI at 0–100 with a period of 14, and RCI at -100–+100 with periods of 9, 26, and 52 as guides, and read each by its own values.
For RCI, adding the free indicator to EdgeGraph FX's MT5 lets you display all three lines together. Check how it moves alongside RSI on an actual chart.
If you would like to try without using real funds, compare how the two move on an EdgeGraph FX demo account.
You can compare how RSI and RCI move on an EdgeGraph FX demo account
Learn how to start a demo account here!