How to Use the FVG and Order Block Indicator: MT5 Guide and When Zones Disappear
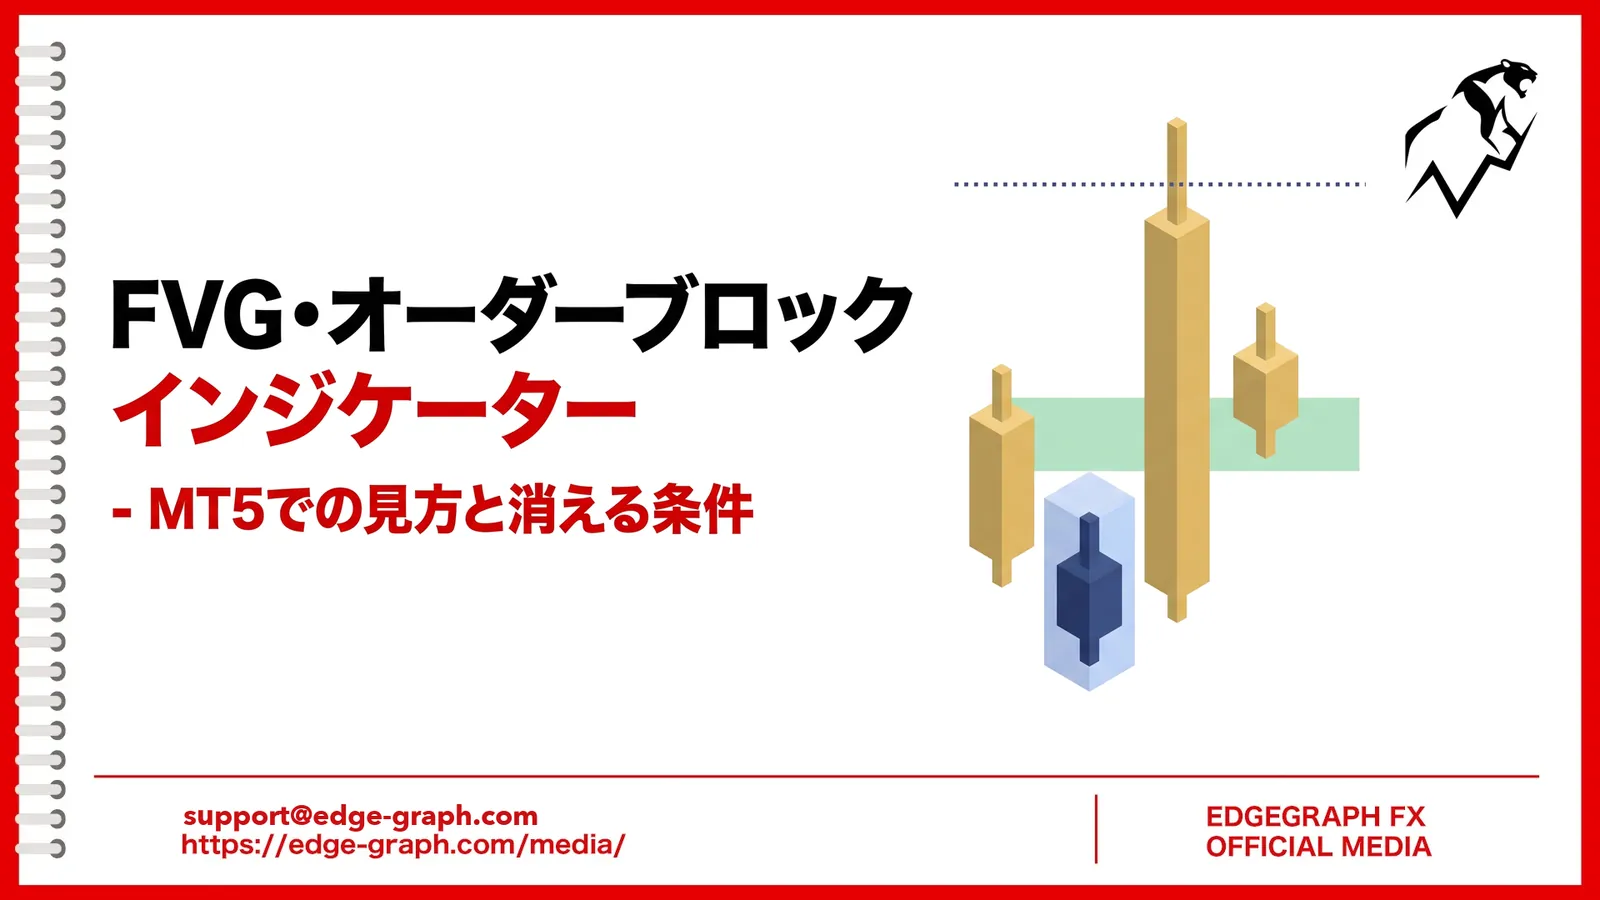
After the market makes a big move in one direction, price sometimes comes back to the same price area after a while. "FVG" and "order blocks" are used in SMC (Smart Money Concepts) analysis as guides for these pullbacks.
However, the indicators built into MT5 do not display FVGs or order blocks. You have to look for gaps between candles and the bar just before a breakout on the chart and draw them yourself.
That is where SMC_FVG_OB, offered by EdgeGraph FX, comes in.
SMC_FVG_OB automatically draws FVGs and order blocks on the chart. By default, zones that price has already returned to and used up are removed automatically, so only zones that may still react remain on the chart.
This article walks through the colors and displays on the chart, when zones are drawn and when they disappear, and the settings to use when there are too many zones.
We offer a free indicator that automatically draws FVGs, order blocks, and BOS on the chart
Get SMC_FVG_OBTable of Contents
- What SMC_FVG_OB Can Do
- What Are FVGs, Order Blocks, and BOS?
- Screen Colors and How to Read the Display
- Zones Are Drawn on Closed Bars
- FVGs and Order Blocks Disappear Differently
- Wait for a Zone That Matches the BOS Direction
- If There Are Too Many Zones, Reduce Them in the Settings
- Frequently Asked Questions
- Summary
What SMC_FVG_OB Can Do
When you add SMC_FVG_OB to a chart, three things are drawn over the candles: FVGs, order blocks, and BOS.
FVGs and order blocks are shown as rectangles that mark a price range. Bullish and bearish zones use different colors, so you can tell by color which direction of move created a zone.
BOS is a dotted line that marks where a recent high or low was broken by a close. Order blocks are determined based on this BOS.
The zones and BOS dotted lines also carry the text labels "FVG," "Bull OB," "Bear OB," and "BOS."
Note that SMC_FVG_OB is an indicator exclusively for EdgeGraph FX and works only on MT5 logged in to an EdgeGraph FX account.
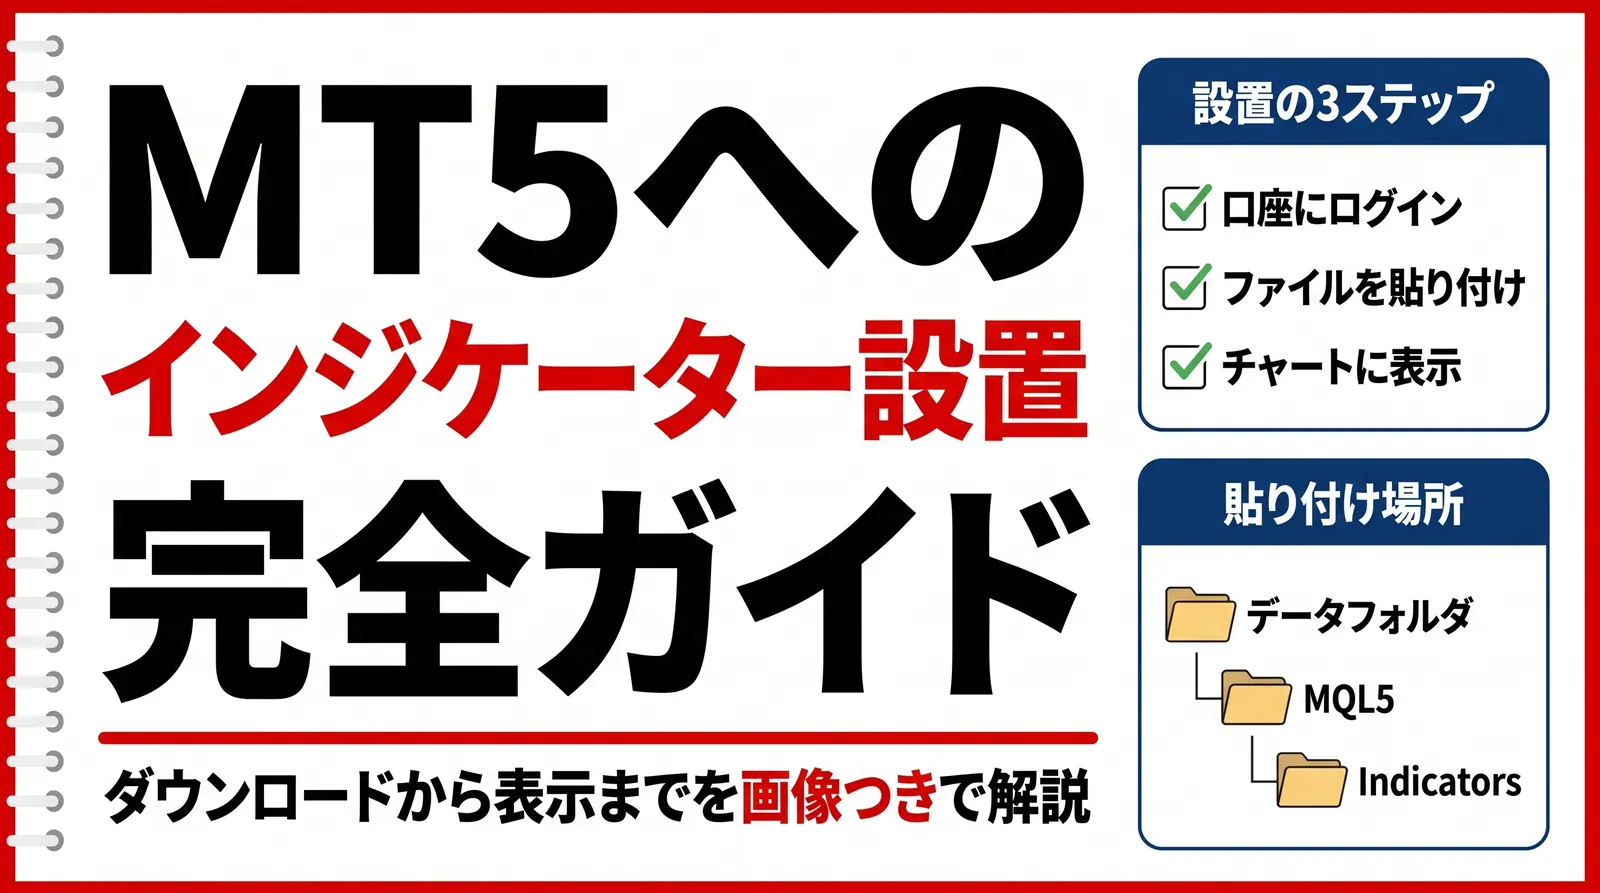
If you want to know how to add an indicator to MT5, check the article below.
What Are FVGs, Order Blocks, and BOS?
FVGs, order blocks, and BOS are three elements often used in SMC to read market structure. In SMC, you follow the flow of the market by watching new highs and lows and the price areas where large orders are thought to have been placed.
An FVG Is a Price Gap Formed by Three Bars
An FVG (Fair Value Gap) is a gap in price created by a sudden move. Among three consecutive candles, it is the part where the ranges of the first and third candles do not overlap.
For example, if a large bullish candle appears and the low of the third candle is above the high of the first, the price range between them becomes a bullish FVG.
An Order Block Is the Opposite-Direction Bar Just Before the Move
An order block is a price area where a large order is thought to have been placed. It uses the opposite-direction candle that appeared just before a strong move that broke a high or low.
For a bullish case, the bearish candle in the decline before the high was broken becomes the order block. SMC_FVG_OB picks the bearish candle with the lowest low among them.
BOS Is the Point Where a High or Low Is Broken
BOS (Break of Structure) is the point where a recent high or low is broken. Breaking above a high is a bullish BOS, and breaking below a low is a bearish BOS.
If BOS keeps appearing in the same direction, it is a sign that the market is moving that way.
Screen Colors and How to Read the Display
The next screenshot shows SMC_FVG_OB on an XAUUSD 1-hour chart.
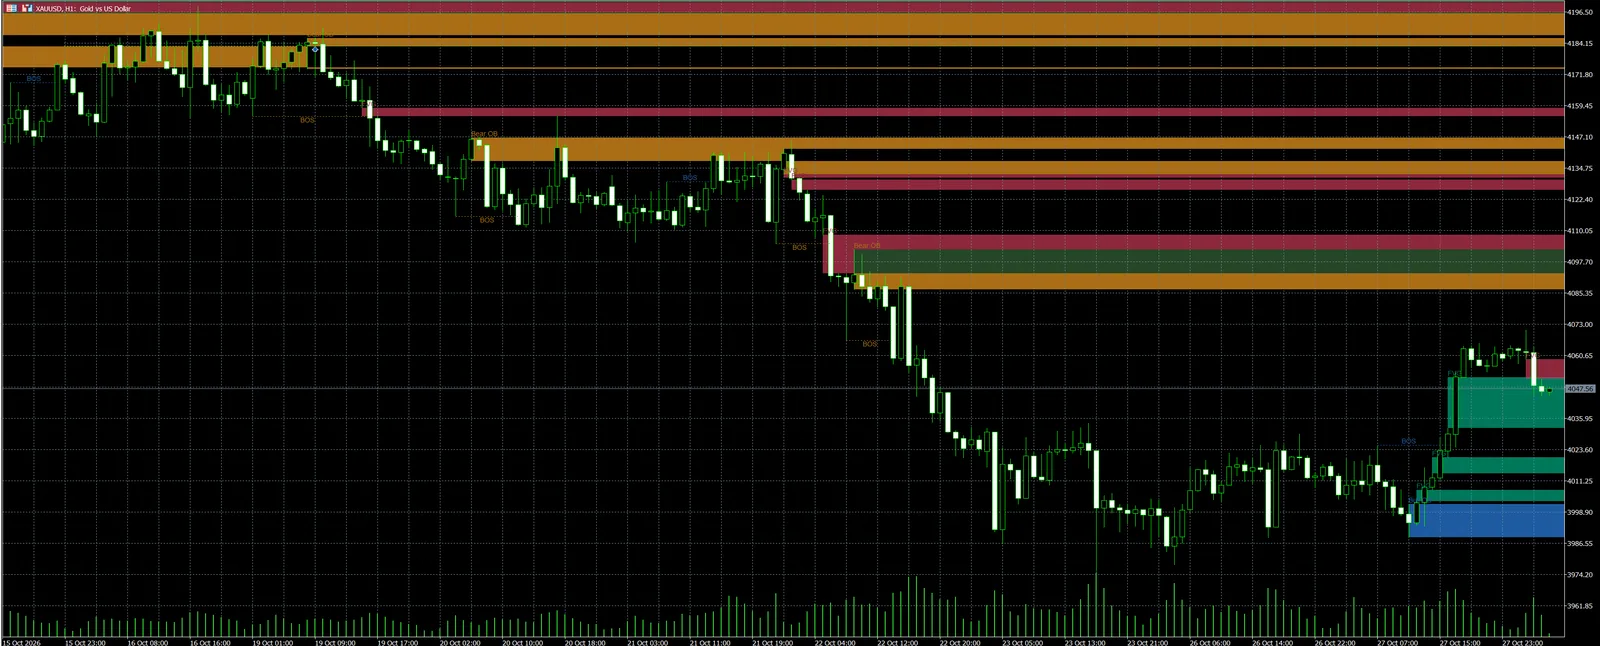
Zone colors and removal conditions drawn on the chart by SMC_FVG_OB from EdgeGraph FX
| Display | Meaning | Removed when |
|---|---|---|
| Green rectangle | Bullish FVG | Price returns to the bottom edge |
| Red rectangle | Bearish FVG | Price returns to the top edge |
| Blue rectangle | Bullish order block | A close falls below the bottom edge |
| Orange rectangle | Bearish order block | A close rises above the top edge |
The BOS dotted lines are blue for bullish and orange for bearish. Each line connects the position of the broken high or low to the bar that made the break.
A rectangle whose right edge extends beyond the latest bar is a zone that has not yet been used up. By default, zones are extended 10 bars to the right of the latest bar.
Zones Are Drawn on Closed Bars
FVGs Appear When the Third Bar Closes
An FVG is drawn once the third bar closes. It is not determined on a forming bar, so an FVG that has been displayed will not change position afterward.
BOS and Order Blocks Wait for the High or Low to Be Confirmed
By default, the high or low used as the BOS reference is determined by comparing with 5 bars on each side. A bar higher than all 5 bars on both sides is a swing high, and a bar lower than all of them is a swing low.
Until the 5 bars on the right are in place, it is not treated as a swing high or low.
After that, a bullish BOS occurs when price closes above the swing high. A BOS is determined only when the break is made by a close, so a bar with just a wick above does not count.
When a BOS appears, the bearish candle with the lowest low among the bars from the swing high to the BOS is drawn as a bullish order block. For a bearish case, it is the reverse: the bullish candle with the highest high between the swing low and the BOS.
An order block is drawn after the BOS is confirmed. It is not shown while price is still moving, and appears for the first time on the bar where the break is confirmed.
FVGs and Order Blocks Disappear Differently
As the table above shows, an FVG disappears when price reaches the opposite edge, but an order block does not disappear just because a wick reaches it. It disappears when a candle closes beyond the opposite side.
If you want to see where a used-up zone stopped, set 「埋まったFVGを消す」 ("Remove filled FVGs") and 「終値で抜けられたOBを消す」 ("Remove OBs broken by a close") to false in the settings screen. Instead of disappearing, the zone stays with its right edge stopped at the bar where it was used up.
There is also an upper limit on the number of zones displayed. By default, up to 20 are shown for each type: bullish FVG, bearish FVG, bullish order block, and bearish order block. Beyond that, the oldest ones disappear first.
Wait for a Zone That Matches the BOS Direction
One example of how to use SMC_FVG_OB is to confirm the direction with BOS and wait for price to come back to a zone in the same direction.
For example, after a bullish BOS appears as a blue dotted line, if price falls and reaches a blue or green rectangle, you look at the candle movement in that price area and decide whether to buy.
On the other hand, if a close falls below the bottom edge of the blue rectangle, that order block disappears. When a rectangle disappears, you can also take it as a decision to stop waiting to buy at that zone.
If you want to place an order after waiting for price to return to a zone, a limit order fills automatically when price reaches that level.
If you want to know how to place a limit order, check the article below.
FVGs and order blocks are guides to price areas where a reaction is possible, and price does not always bounce from those areas.
Do not decide trades based on zones alone; also check the flow of the market with other technical indicators.
If There Are Too Many Zones, Reduce Them in the Settings
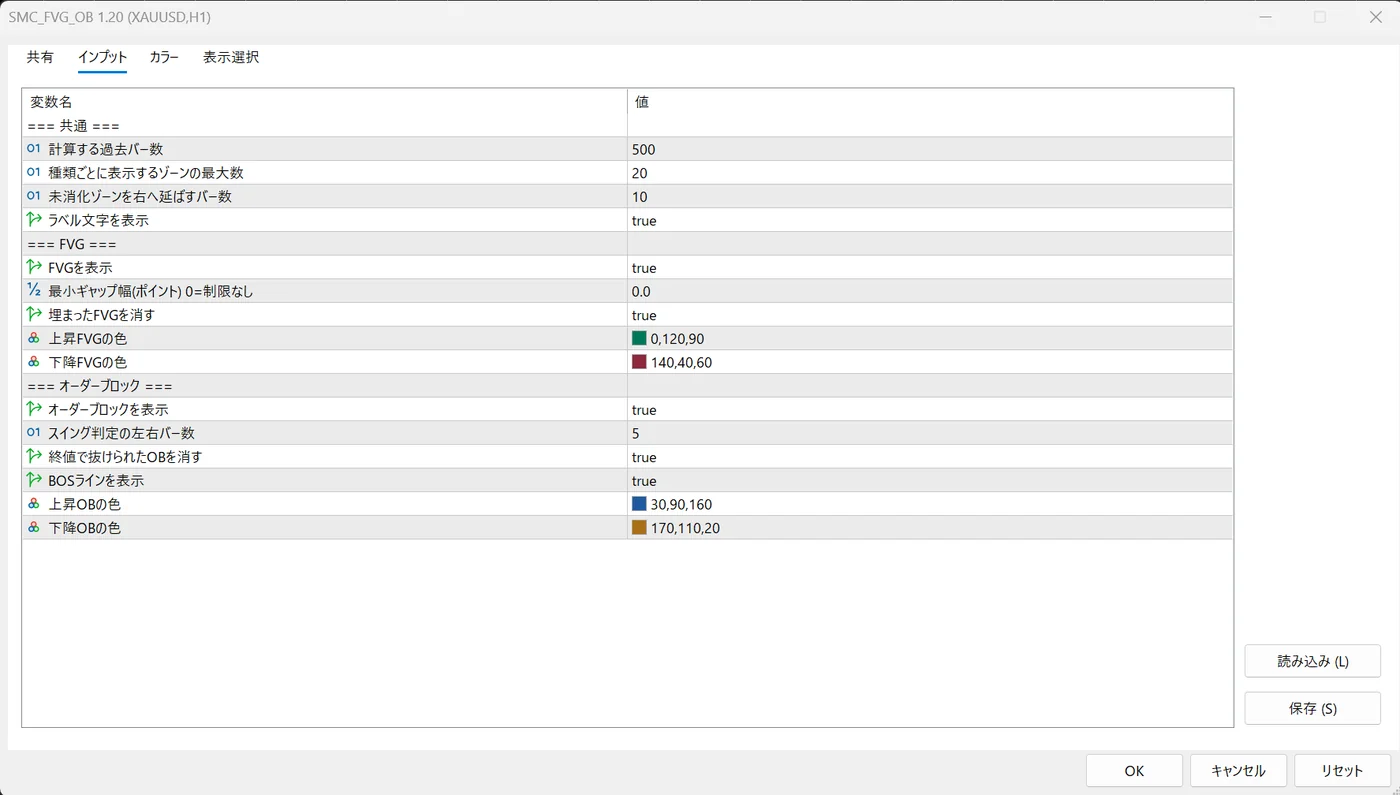
You can change the number of zones and the range drawn in the 「インプット」 ("Inputs") tab of the settings screen that appears when you add SMC_FVG_OB to a chart.
Items to change when adjusting the display of SMC_FVG_OB from EdgeGraph FX
| Problem | Item to change | How to change it |
|---|---|---|
| Too many zones | 「種類ごとに表示するゾーンの最大数」 ("Maximum number of zones shown per type") | Reduce it from the default of 20 |
| Too many small FVGs | 「最小ギャップ幅(ポイント)」 ("Minimum gap width (points)") | Raise it from the default of 0.0 |
| Too many order blocks | 「スイング判定の左右バー数」 ("Swing detection: bars on each side") | Increase it from the default of 5 |
| You want to see past zones | 「計算する過去バー数」 ("Number of past bars to calculate") | Increase it from the default of 500 |
Increasing the number of bars on each side for swing detection picks up only the highs and lows of larger waves, so the number of BOS and order blocks decreases. However, they are not confirmed until the bars on the right are in place, so the display is delayed by that much.
If you set 「オーダーブロックを表示」 ("Show order blocks") to false, the BOS dotted lines are no longer displayed either. If you want to hide only the BOS dotted lines, set 「BOSラインを表示」 ("Show BOS lines") to false.
You can change the zone colors with items such as 「上昇FVGの色」 ("Bullish FVG color") and 「下降OBの色」 ("Bearish OB color").
Calculation runs only when a new bar closes. If it still feels slow, try reducing 「計算する過去バー数」 ("Number of past bars to calculate").
If you want to see the other indicators EdgeGraph FX distributes, check the article below.
Frequently Asked Questions
Summary
SMC_FVG_OB zones are drawn only on closed bars, and by default an FVG disappears when price reaches the opposite edge, and an order block disappears when a close breaks the opposite side. A rectangle that extends to the right is a zone that has not yet been used up.
You can download SMC_FVG_OB for free from the download page on the EdgeGraph FX official website. The listed name is "SMC_FVG_OB" and the file name is SMC_FVG_OB.zip.
If you feel there are too many zones, a good first step is to reduce 「種類ごとに表示するゾーンの最大数」 ("Maximum number of zones shown per type") and see how the display changes.
We offer a free indicator that automatically draws FVGs, order blocks, and BOS on the chart
Get SMC_FVG_OB