How to Use the Currency Strength Indicator: Reading It on MT5 and Choosing Strong and Weak Currencies
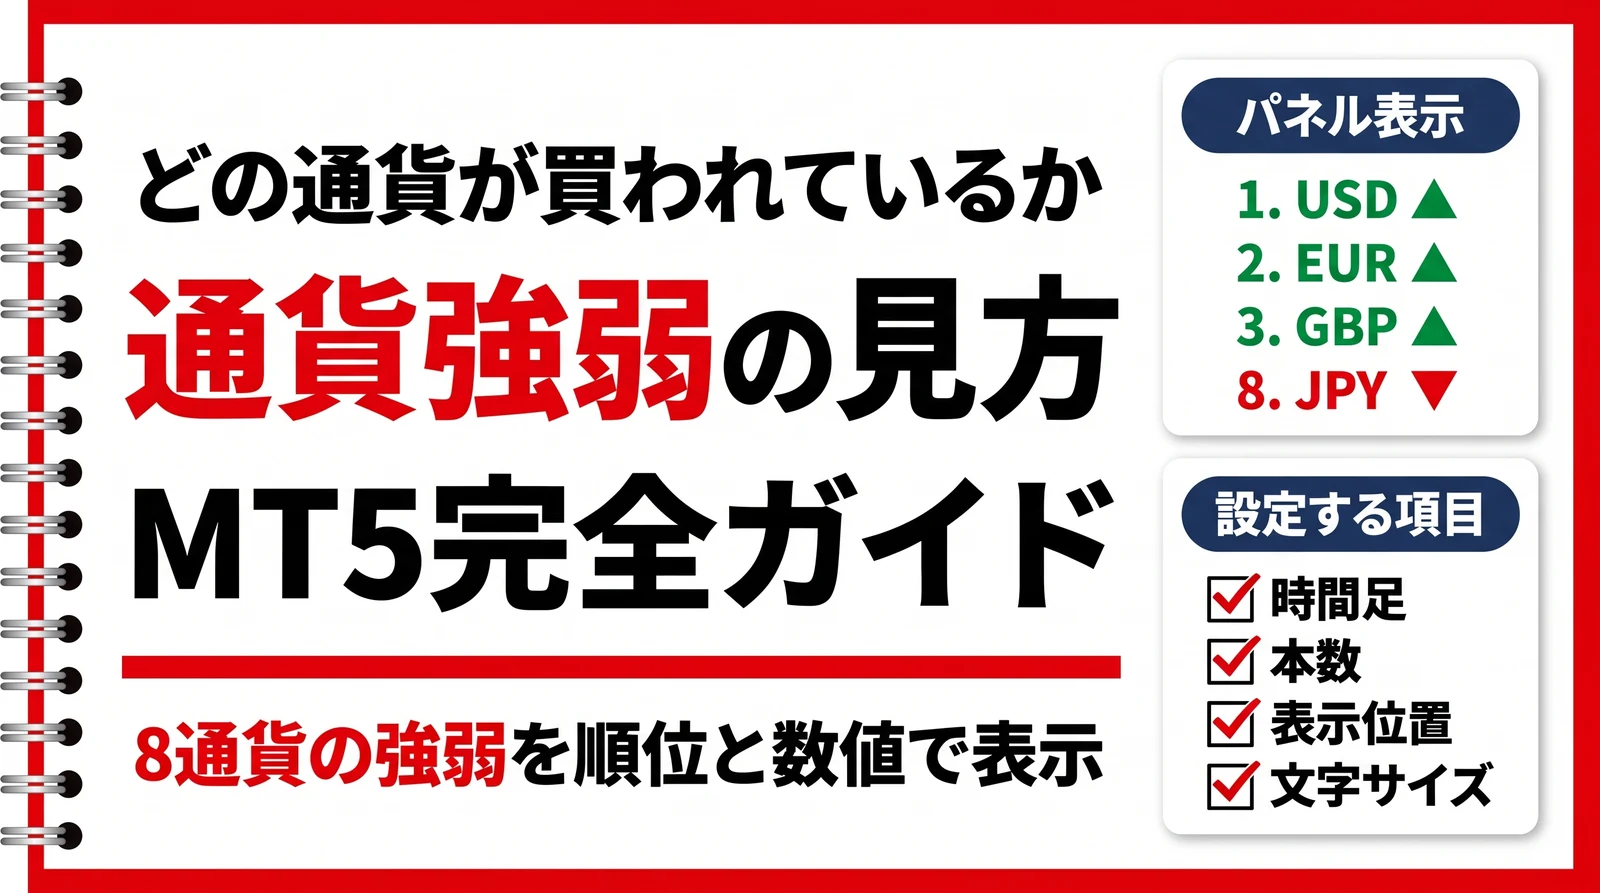
Currency strength is a way of looking at which currencies are being bought and which are being sold, currency by currency. When USD/JPY rises, you cannot tell from the currency pair chart alone whether the dollar was bought or the yen was sold.
On MT5, installing a currency strength indicator lets you calculate each currency's strength from the price movements of multiple currency pairs and show it all on one screen. This article uses the currency strength meter distributed by EdgeGraph FX as an example to explain what the numbers mean and how to use them.
We distribute the "Currency Strength Meter", which shows the strength of 8 currencies by rank and value, together with a user manual
Get the Currency Strength MeterTable of Contents
Why look at currencies rather than currency pairs
A currency pair chart reflects only the balance of power between two currencies. Even when USD/JPY is rising, a single chart cannot tell you what is happening behind it.
Looking at currency strength lets you separate whether the dollar is being bought against all currencies or only the yen is being sold. If the dollar is strong across the board, it is likely that EUR/USD and GBP/USD also show a move in the same direction.
Combining a strong currency with a weak one makes it easier to choose currency pairs with large price movements. Conversely, if both are about equally strong, that pair is in a state where a direction is hard to emerge.
The 4 display formats for currency strength on MT5
A currency strength indicator looks different depending on how it is displayed.
Display formats of currency strength indicators available on MT5
| Display format | What you can see | Best suited for |
|---|---|---|
| Line chart | Trend and direction of strength; small differences in values are hard to read | Follow trend continuation or reversal visually |
| Heat map | Overall tendency by color shade; exact values are not shown | Get a rough overall picture |
| Arrows / ranking | Current rank; changes over time are not visible | Just know which is strong right now |
| Numeric panel display | Rank, strength value and color can be checked at the same time | Choose currency pairs taking the numeric differences into account |
EdgeGraph FX's currency strength meter is a numeric panel type that always displays 8 currencies on one screen.
Not sure how to add an indicator to MT5? Check out this article!
How is the strength score calculated?
The currency strength meter aggregates the price movements of the 28 currency pairs made from the 8 major currencies. The currencies covered are USD, EUR, GBP, JPY, AUD, NZD, CAD and CHF.
A currency's strength score is the average of the signed sum of the percentage changes of the 7 pairs involving that currency. For EUR, it looks at the 7 pairs EURUSD, EURGBP, EURJPY, EURAUD, EURCAD, EURNZD and EURCHF.
If the currency is the base currency, its percentage change is added as positive; if it is the quote currency, as negative.
The percentage change itself is the value obtained by subtracting the closing price from the specified number of bars ago from the current closing price, dividing that by the closing price from the specified number of bars ago, and multiplying by 100. The larger the plus, the more the currency is being bought; the larger the minus, the more it is being sold.
The values are recalculated every 15 seconds. They are also updated when a new price arrives.
3 points for reading the panel
With just numbers lined up, many people may wonder where to start looking. Checking three things from the top down makes it easier to read.
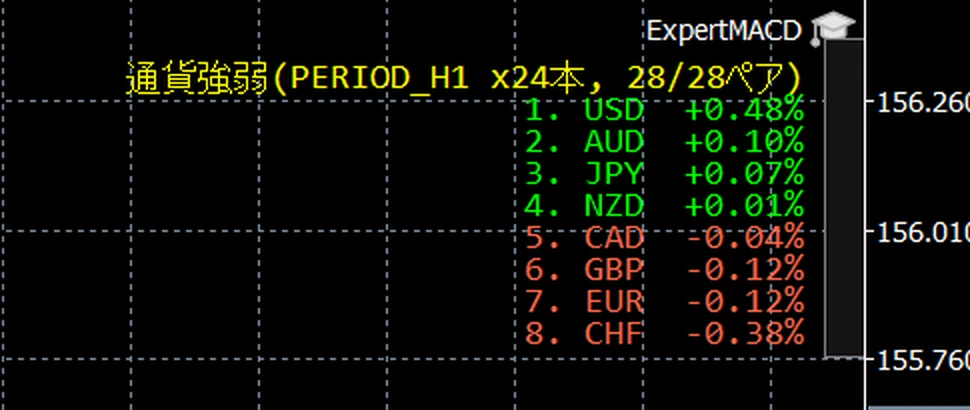
1. Check the number of pairs used
The first line of the panel shows the timeframe and number of bars in use, and the number of pairs that could actually be used in the calculation. If it shows 28 of 28 pairs, the calculation uses the data of all pairs.
If your account does not offer certain currency pairs, the calculation excludes those pairs. That is why the displayed number may be smaller.
2. Look at the rank and strength value
From the second line, "rank. currency code strength value" are listed from strongest. The currency in 1st place is the most bought in that period, and the one at the bottom is the most sold.
However, rank is not the only thing to look at. If the gap between 1st and 2nd place is small, the balance of power between those two currencies is not clear.
The further apart the top and bottom values are, the more likely the combination is to produce a direction.
3. Use color as a supplement
The strength values are color-coded. Green is positive, red is negative, and white is nearly zero. Colors can be changed in the Colors tab of the settings screen.
If you follow only the ups and downs of rank, you may confuse a 1st place among generally weak currencies with a 1st place that is actually being bought. Looking at color together keeps you from misreading it.
The 5 settings you can adjust
When you add it to a chart, the input parameters screen opens. Change the values and press "OK" to apply them.
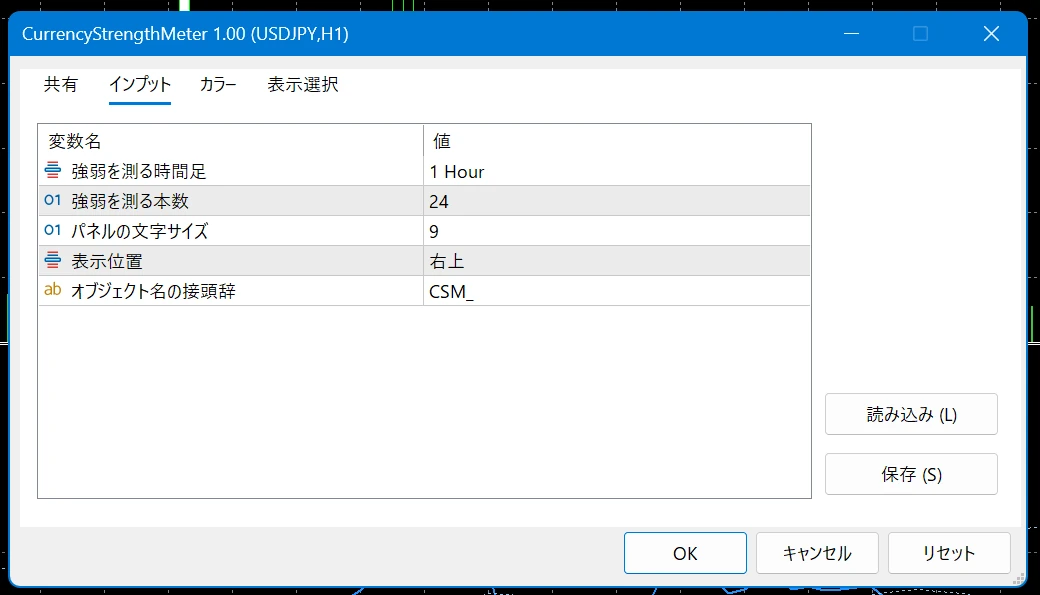
Input parameters of the EdgeGraph FX currency strength meter
| Setting | Default | Description |
|---|---|---|
| Timeframe for measuring strength | 1 Hour | Type of bars used for aggregation |
| Number of bars for measuring strength | 24 | Number of bars aggregated |
| Panel font size | 9 | Size of the text shown on the panel |
| Display position | Top right | Where to place the panel |
| Object name prefix | CSM_ | Name used for internal management |
The object name prefix is used for internal management, so you can leave it at the default.
How to decide the measurement period
The combination of timeframe and number of bars becomes the measurement period as it is. The default is 24 bars of the 1-hour timeframe, so strength is calculated from price movement over roughly the last 24 hours.
A shorter period reacts more easily to recent moves, and a longer one makes it easier to catch the larger flow. For day trading, a few hours to a day; for swing trading, several days. It is good to decide according to your own holding period.
Panel position and font size
You can choose the panel position from top right, bottom right, bottom left, top left, top center and bottom center. If it overlaps with other indicators, change the position.
If the text feels small, increase the panel font size value.
Automatic detection of symbol suffixes
On overseas FX accounts, symbol names sometimes have characters such as ".c1" or ".m" attached. The currency strength meter automatically detects this part from the symbol name of the chart it is attached to, and attaches the same suffix to all 28 pairs to fetch the data.
It also works with ordinary symbol names that have no suffix. You do not need to enter anything in the settings.
When the number of usable pairs is extremely low, for example below half, it is likely that detection is not working properly. Check the symbol name of the chart.
Limits of the currency strength score
Currency strength shows relatively which currencies were bought in that period. It is not an indicator that predicts future price movement.
Buying the 1st-place currency and selling the last-place one does not always win. Strength can also reverse after the gap has fully widened.
Use it in combination with other grounds such as trend direction and support/resistance.
Want to cover price zones that tend to become key levels too? Check out this article!
Besides the currency strength indicator, if you want to find MT5 indicators by purpose, check the article below!
FAQ
Summary
The currency strength meter shows the strength of 8 currencies on a panel by rank and value.It calculates each currency's score from the percentage changes of 28 currency pairs and updates every 15 seconds.
When reading, first confirm the number of usable pairs on the first line, then look at the rank and values, and finally supplement with color. This keeps you from getting lost. The further apart the top and bottom, the more likely the combination is to produce a direction.
The measurement period can be set freely with the timeframe and number of bars, so try adjusting it to match your own holding period.
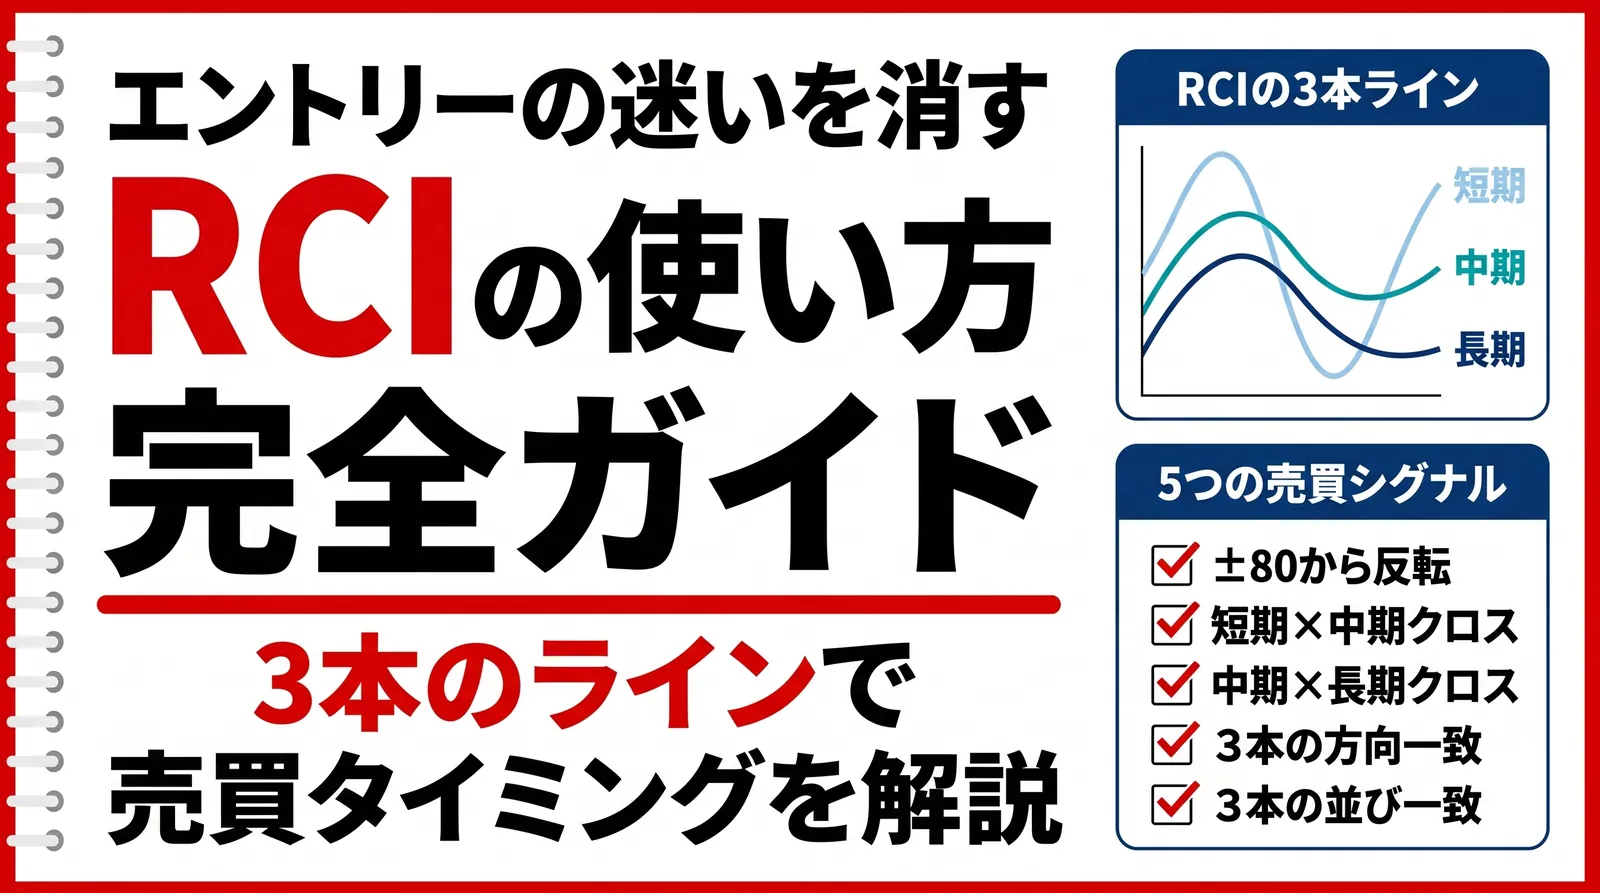
Want to know how to read market momentum with RCI too? Check out this article!
We distribute the "Currency Strength Meter", which shows the strength of 8 currencies by rank and value, together with a user manual
Get the Currency Strength Meter