How to Use the Elliott Wave Indicator: Automatic Counting and Telling Waves Apart on MT5

Elliott Wave theory is a form of chart analysis that counts a trend as five waves followed by three waves. However, the count changes depending on where you place Wave 1, so different traders read the same chart differently.
MT5 includes objects for drawing impulse and corrective waves, but choosing the starting point and clicking each point is left to you. Once you install the indicator, wave numbers are assigned automatically.
In this article, we use the Elliott Wave indicator distributed by EdgeGraph FX as an example to explain how to read the automatically assigned waves.
We distribute an Elliott Wave indicator, complete with a user manual, that automatically assigns impulse waves 1-5 and corrective waves A-B-C
Get the Elliott Wave indicatorTable of Contents
Impulse and Corrective Wave Basics
In Elliott Wave theory, a trend is thought to advance in five waves in its direction, followed by three waves of correction. The first five are called the impulse wave, and the latter three are called the corrective wave.
Impulse waves are numbered 1 to 5, and corrective waves are labeled A to C.
Three rules are commonly cited: Wave 2 must not retrace beyond the start of Wave 1, Wave 3 must not be the shortest of the impulse waves, and Wave 4 must not overlap the high of Wave 1.
Wave Colors and Automatic Counting
This indicator detects swing points on the chart and assigns labels in the order 1, 2, 3, 4, 5, A, B, C. Eight labels make one set, and the sequence then repeats.
Labels are color-coded. By default, 1, 3, and 5 (the impulse waves) are yellow-green, and 2, 4, A, B, and C (the corrective waves) are orange.
As a rule of thumb, while an impulse wave continues, it is a phase of following the trend; during a corrective wave, it is a phase of pullbacks or retracements.
How to Tell Confirmed Waves from Forming Waves
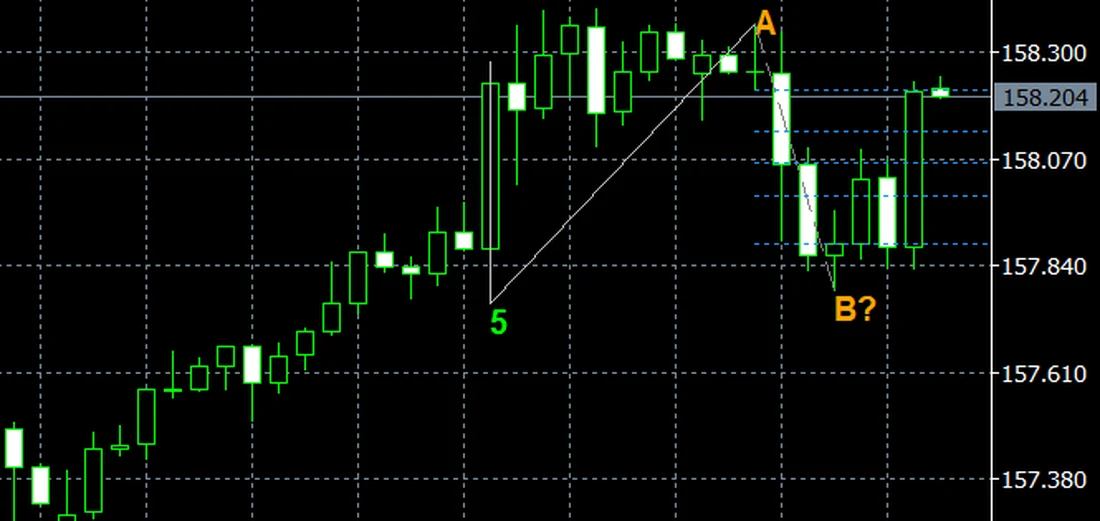
The waves on the chart fall into two groups: those already confirmed and those still forming.
Differences between confirmed and forming waves in the EdgeGraph FX Elliott Wave indicator
| How to tell | Confirmed wave | Forming wave |
|---|---|---|
| Line appearance | Solid silver line | Grey dashed line |
| Label | Number or symbol only | Number or symbol followed by "?" |
| Future behavior | Does not change | The tip moves as new highs or lows are made |
The part drawn with solid silver lines will not change with future price movement. Look at this part when reviewing past market phases.
Why Labels Change Later
The tip of a forming wave keeps moving for as long as price keeps making new highs or lows. The label position changes along with it.
A spot that was labeled Wave 3 yesterday may carry a different number today.
This behavior is called repainting, and it is common to indicators that detect waves with ZigZag. It is not a malfunction.
Wave confirmation requires two conditions: the minimum bar interval and the minimum reversal percentage. When both are met, the previous swing point is confirmed.
Price Guide for the Next Wave Confirmation
The panel in the upper left shows which wave is currently forming and the number of the most recently confirmed wave.
It also gives a guide to what comes next. In the form "Wave 3 confirmed with the decline to this point; moving to Wave 4," it shows the price needed for confirmation.
However, this price is not a fixed target. It moves in step with every new high or low made by the forming wave.
When there are not enough bars yet, the number of additional bars needed is shown as well.

What Automatic Counting Cannot Tell You
Labels are assigned mechanically from the start of the history. There is no guarantee that the first bar visible when you open the chart is a true Wave 1.
This indicator does not strictly verify the Elliott Wave rules. It is only a rough guide to which phase the market is likely in.
Available Settings
The parameter settings window opens right after you add the indicator to the chart.
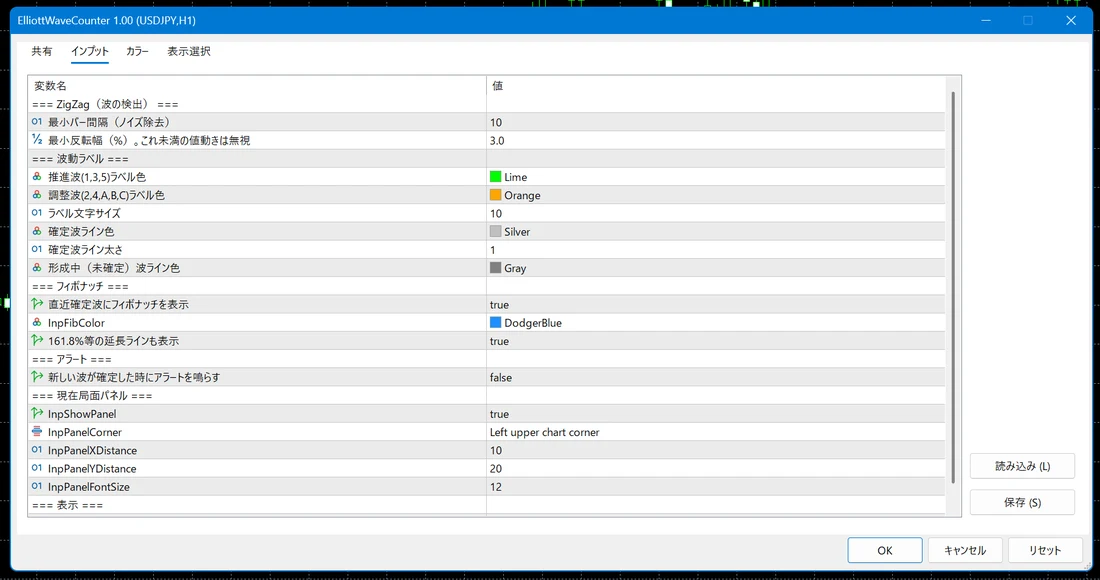
Main settings of the EdgeGraph FX Elliott Wave indicator and their default values
| Setting | Default | What it changes |
|---|---|---|
| Minimum bar interval | 10 | The smaller the value, the finer the waves it picks up |
| Minimum reversal percentage | 3.0% | The smaller the value, the more waves appear |
| Show Fibonacci | true | Draws retracements on the most recent confirmed wave |
| Show extension lines | true | Adds lines at 127.2% and 161.8% |
You can also change the label color and font size, and the color and thickness of the lines connecting the waves.
To check how to install an indicator on MT5, see this article.
Besides Elliott Wave, if you want to find MT5 indicators by purpose, check the article below!
FAQ
Summary
The confirmed waves drawn with solid silver lines are the ones you can use as a foundation for your decisions. The grey dashed parts change shape every time price moves.
Wave numbers are assigned mechanically from the start of the history. Even if a label shows Wave 1, it is not necessarily the true starting point.
Elliott Wave analysis is, by nature, open to differing interpretations. The market will not necessarily follow the numbers, so use it together with other indicators.
The Elliott Wave indicator is distributed free of charge by EdgeGraph FX, together with a user manual.
If you would like to see other tools that automatically identify trend turning points, see this article.
We distribute an Elliott Wave indicator, complete with a user manual, that automatically assigns impulse waves 1-5 and corrective waves A-B-C
Get the Elliott Wave indicator