How to Use the Previous Day High/Low Indicator: Display Settings and Reading the Lines on MT5
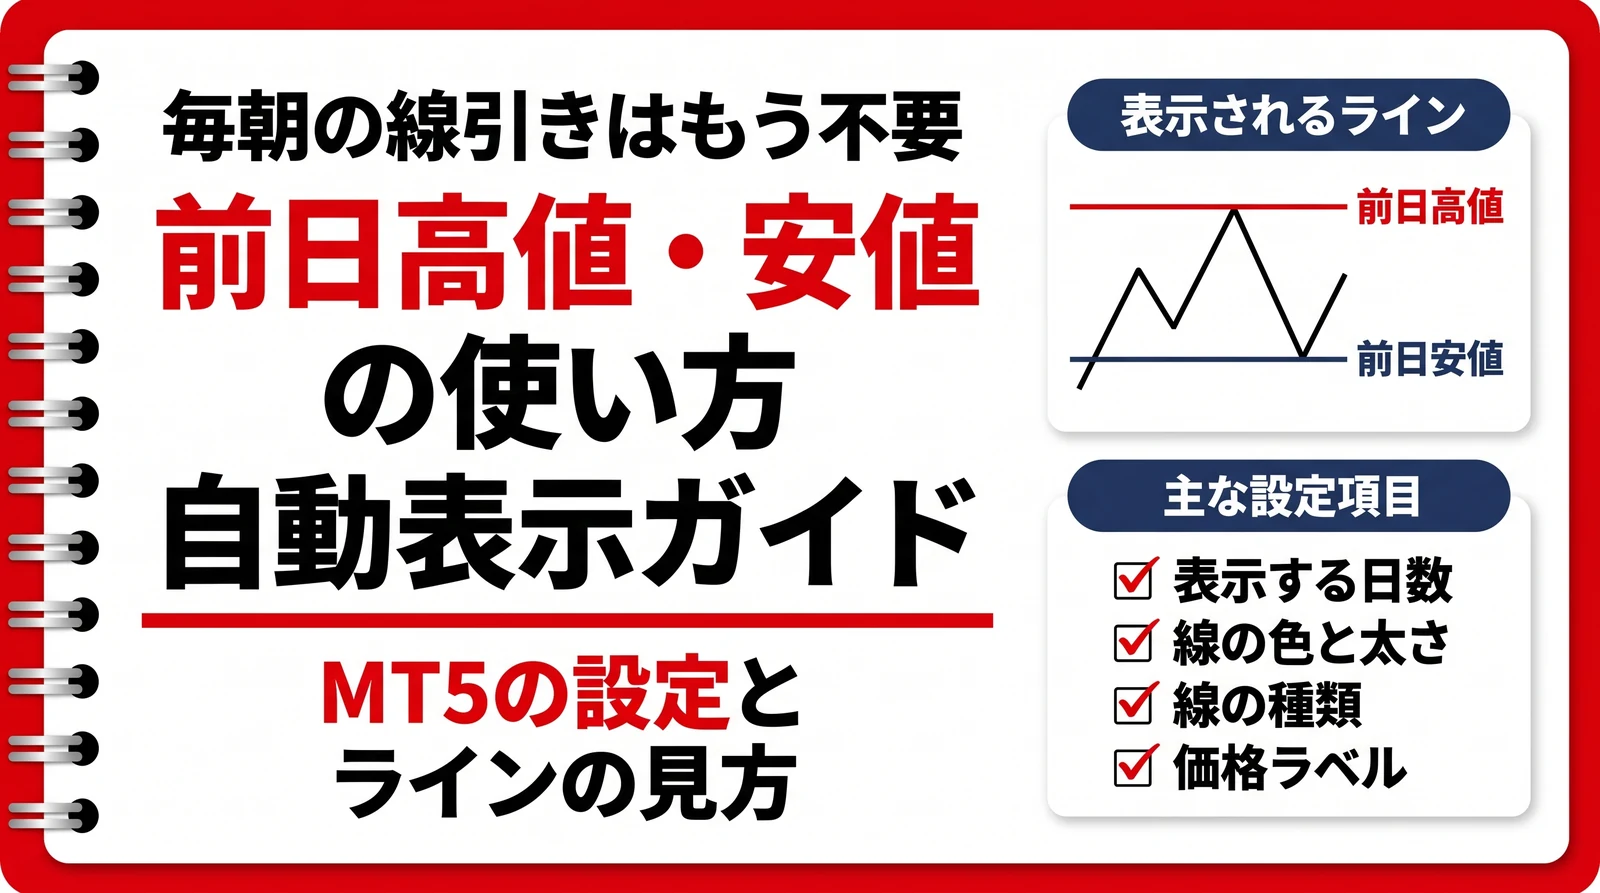
The previous day's high and low are prices that many traders watch as key levels. On MT5, a previous day high/low indicator draws these two lines automatically and updates them every time the date changes. You no longer need to open the chart each morning and redraw them by hand.
This article covers the previous day high/low indicator distributed by EdgeGraph FX, from getting it to configuring it and reading the lines.
We distribute the "Previous Day High/Low Indicator", which draws the previous day's high and low automatically, together with a user manual
Get the Previous Day High/Low IndicatorTable of Contents
Why the previous day's high and low are seen as key levels
The previous day's high is the highest price reached yesterday, and the previous day's low is the lowest.
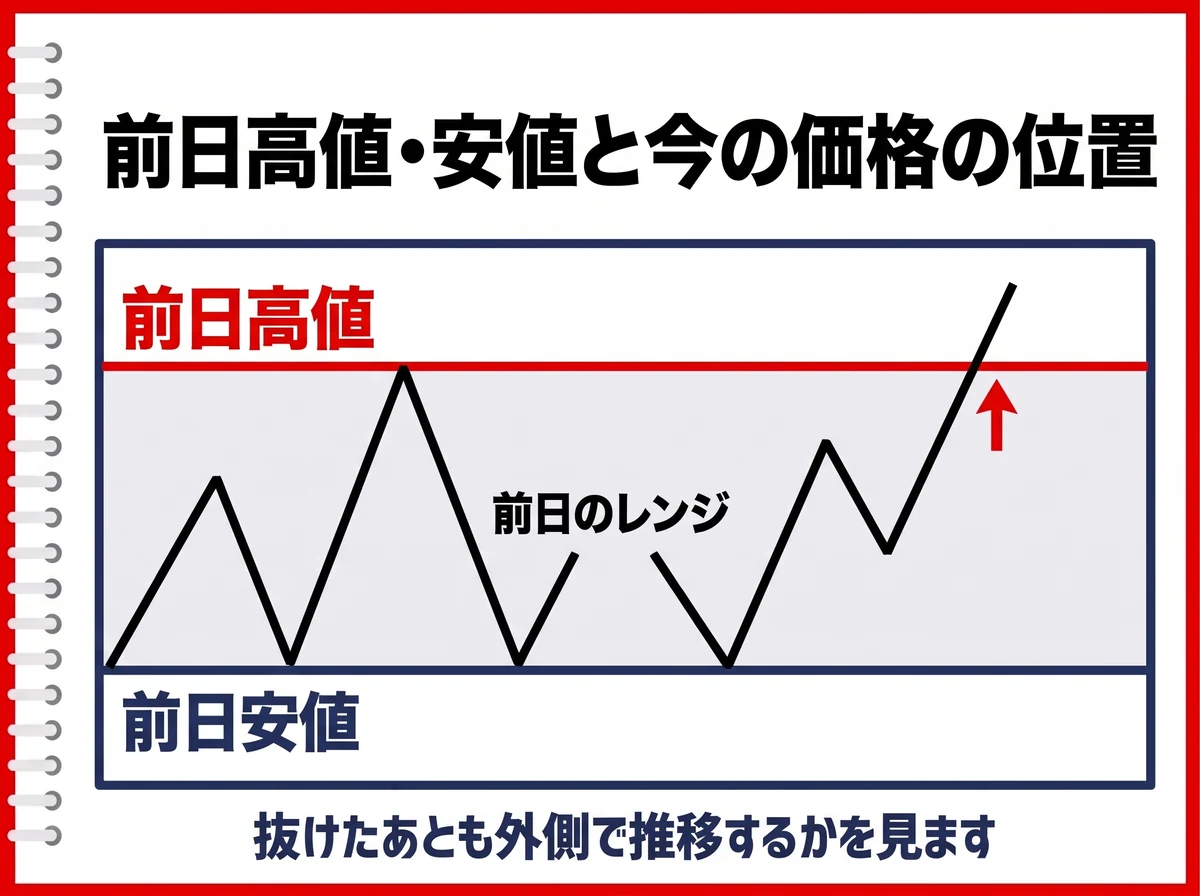
With these two lines displayed, you can see at a glance whether the current price is still within yesterday's range or has broken out above or below it. While price stays inside the range, yesterday's range is continuing, and new price action can be seen as starting from the point where it breaks out.
Because many traders look at the same prices, price may bounce just before a high or low, or gain momentum right after breaking through. The lines themselves have no power; the reason is simply that many people are watching the same reference.
What the previous day high/low indicator can do
The distributed indicator automatically draws past highs and lows on the chart as horizontal reference lines.
It does more than draw the previous day's line on the current day's chart: it can look back over a number of days you specify and display the daily lines all together. You can compare where price stopped yesterday and the day before side by side, which makes it easier to tell whether the same price zone is being watched repeatedly.
What is displayed is the high and low of each day. For example, even if you set 5 days, it does not draw a line at the highest high and lowest low across those five days.
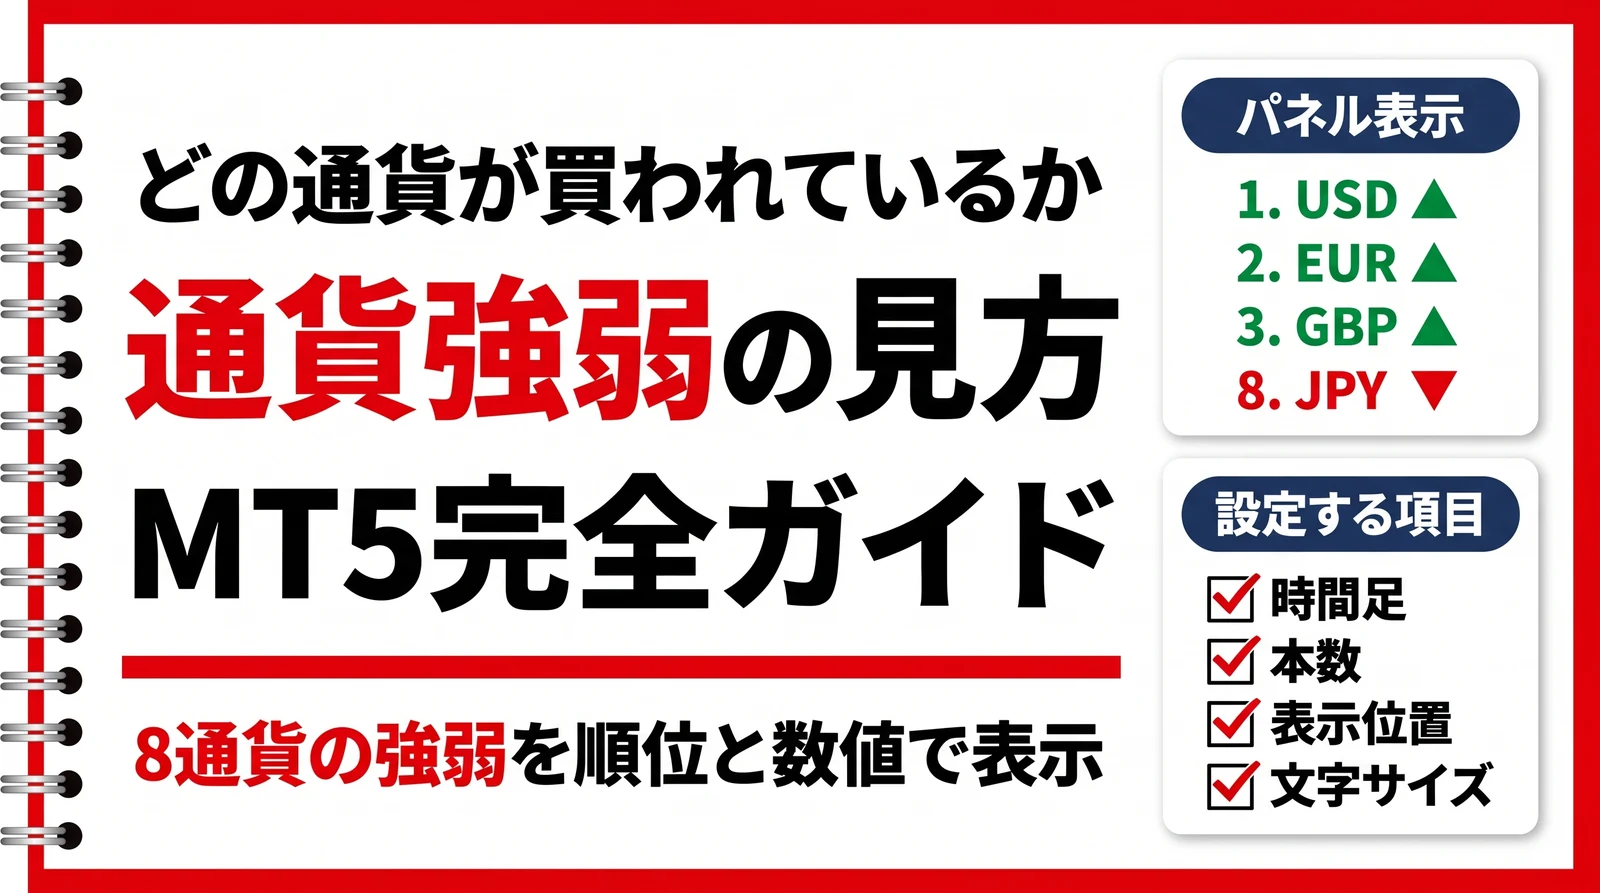
Want to check the strength of each currency too? Check out this article!
Getting and installing the indicator
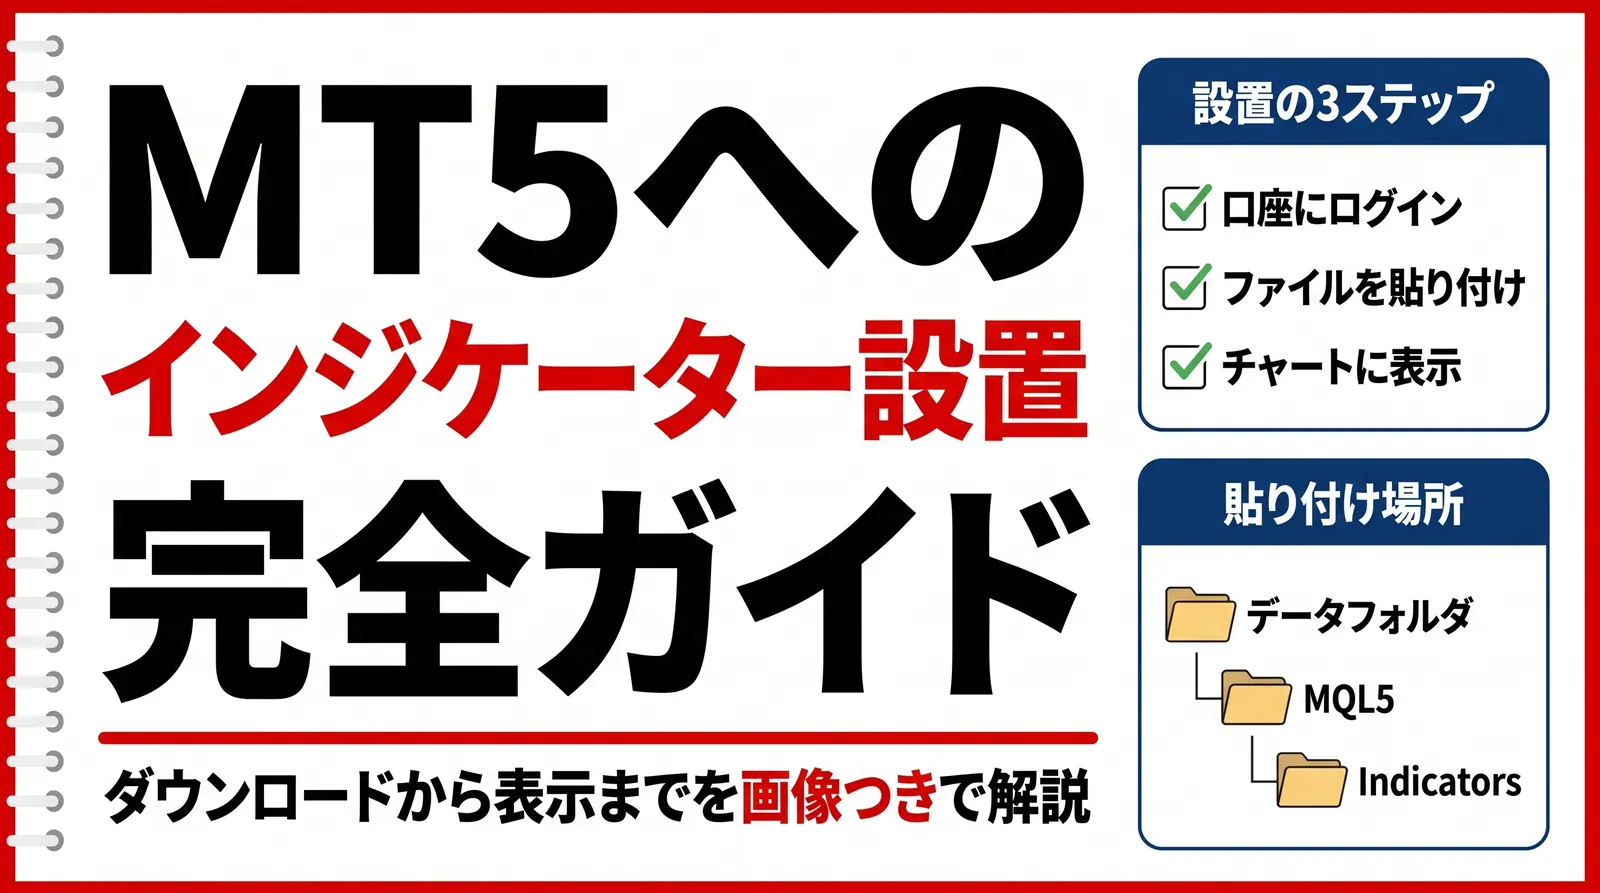
From "Previous Day High/Low Indicator" on the download page, get PrevDayHighLow.zip. When unzipped, it contains the indicator itself, PrevDayHighLow.ex5, and a user manual.
To use it, you must be logged in to an EdgeGraph FX account on MT5. It is licensed for EdgeGraph FX, so it does not work on accounts connected to other companies' servers. It is for MetaTrader 5 only and cannot be used on MT4.
If you are not sure how to add it to MT5, the steps are summarized in this article.
List of settings and how to use them
When you add the indicator to a chart, the input parameters screen opens. Change the values and press "OK" to apply the settings.
List of settings
Settings of the EdgeGraph FX previous day high/low indicator
| Input | Default | Description |
|---|---|---|
| InpDaysToShow | 5 | Number of days to display |
| InpHighColor | Red | High line color |
| InpHighStyle | Solid | High line style |
| InpHighWidth | 1 | High line width |
| InpLowColor | Dodger Blue | Low line color |
| InpLowStyle | Solid | Low line style |
| InpLowWidth | 1 | Low line width |
| InpShowLabel | true | Price label at the right end of the line |
| InpFontSize | 8 | Price font size |
| InpPrefix | PDHL_ | Prefix for drawn object names |
InpPrefix is used to manage drawn objects, so you can leave it at the default. You can change the settings later by opening the indicator's properties.
Deciding how many days to look back
How far back the past lines are displayed is set with InpDaysToShow. The default is 5 days, and 5 to 10 days is a reasonable guide.
The more days you add, the more past levels appear, making it easier to check whether the same price zone has been watched many times. However, if you add too many, lines overlap and the chart becomes hard to read. Start with the default, and if it feels insufficient, widen to 10 days. Adjusting in this order keeps you from getting lost.
Adjusting when the lines are hard to tell apart
The high and low lines can each have their color, width and line style changed individually. If they are easily confused with other indicators or horizontal lines you drew yourself, changing the line style to dashed or setting the width to 2 or more makes them easier to distinguish.
The price is displayed at the right end of each line. If the text is too small, increase InpFontSize. If you would like to remove the numbers and keep only the lines, set InpShowLabel to false.
When are the lines updated?
The lines are updated when the daily bar updates, or at the timing of a timer check every 30 seconds.
The "previous day" here means one daily bar in MT5. Because MT5's daily bars are divided by server time, they do not match midnight in Japan time. Checking once where the daily bar switches on your own chart will help you grasp when the lines update.
If the high and low values differ from other tools or sites, check whether you are looking at the same symbol over the same period. A high and low tallied only over Tokyo market hours will differ in price from the high and low for the whole previous day.
How to read it when price approaches the high or low
When price approaches the previous day's high or low, watch whether it reverses there or keeps going through.
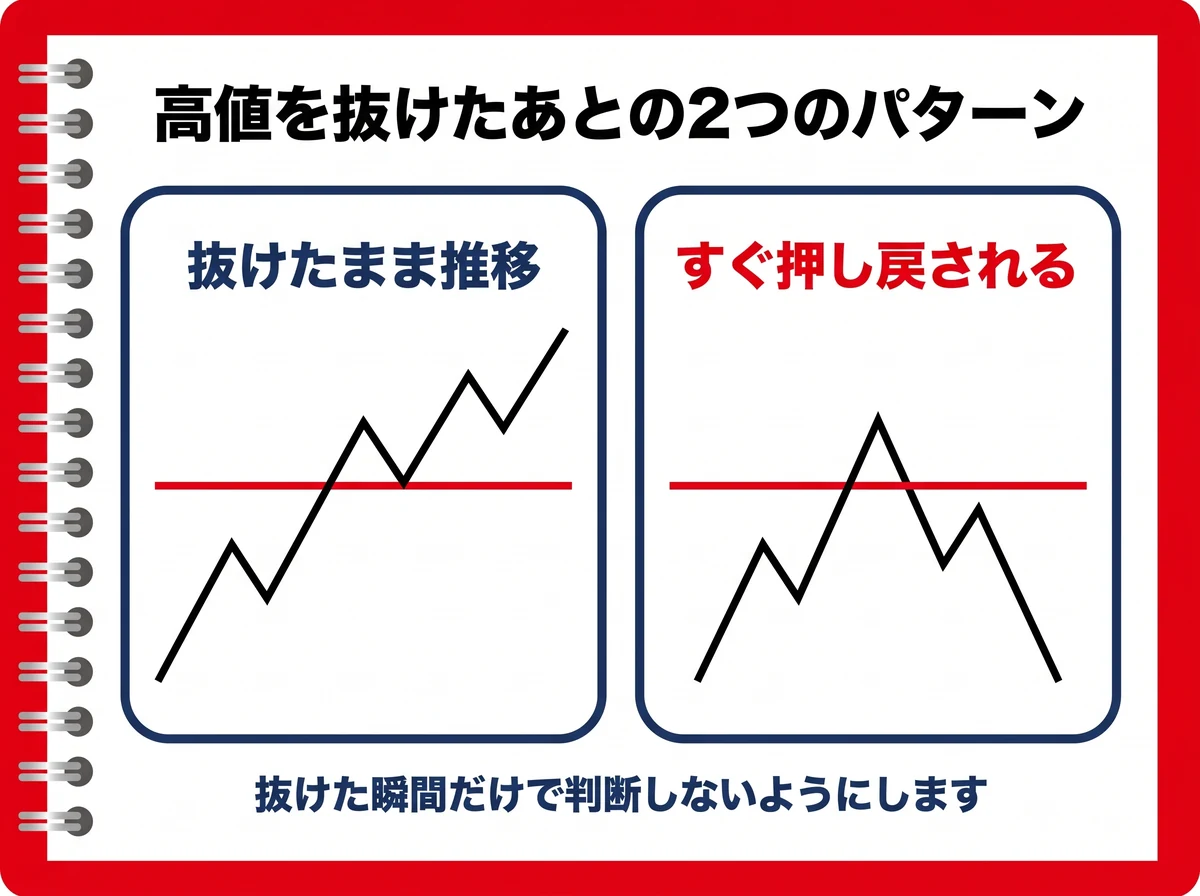
Even if price appears to have broken above, it may be pushed back immediately. Rather than judging only at the moment of the breakout, check whether price keeps trading above the high afterward. This helps you avoid false breakouts.
The lines show past highs and lows and do not guarantee a reversal or any subsequent price movement. Do not decide trades solely because price touched a line; judge together with the trend direction and other grounds.
Among the indicators we distribute, how to read market momentum using RCI is also explained.

Besides the previous day high/low indicator, if you want to find MT5 indicators by purpose, check the article below!
FAQ
Summary
If you install the previous day high/low indicator, you no longer need to draw horizontal lines by hand each morning, and the lines update automatically every time the date changes.
There are only two things to adjust in the settings: the number of days to look back and the appearance of the lines. Start by displaying the default 5 days; if the chart is hard to read, reduce the number of days, and if the lines are confusing, change the color or line style. Adjusting in this order keeps you from getting lost.
The lines are only reference lines. They do not guarantee a reversal, so use them in combination with other grounds.
We distribute the "Previous Day High/Low Indicator", which draws the previous day's high and low automatically, together with a user manual
Get the Previous Day High/Low Indicator